
Advertisement
Risks Still Elevated At These Prices As Yunfeng Financial Group Limited (HKG:376) Shares Dive 34%
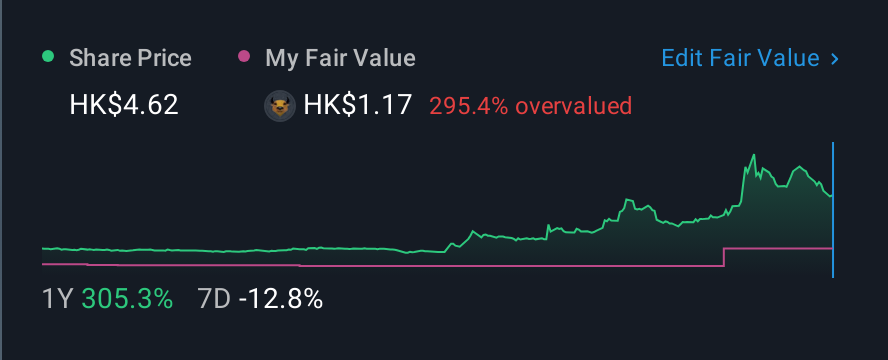
Yunfeng Financial Group Limited (HKG:376) shares have retraced a considerable 34% in the last month, reversing a fair amount of their solid recent performance. The good news is that in the last year, the stock has shone bright like a diamond, gaining 240%.
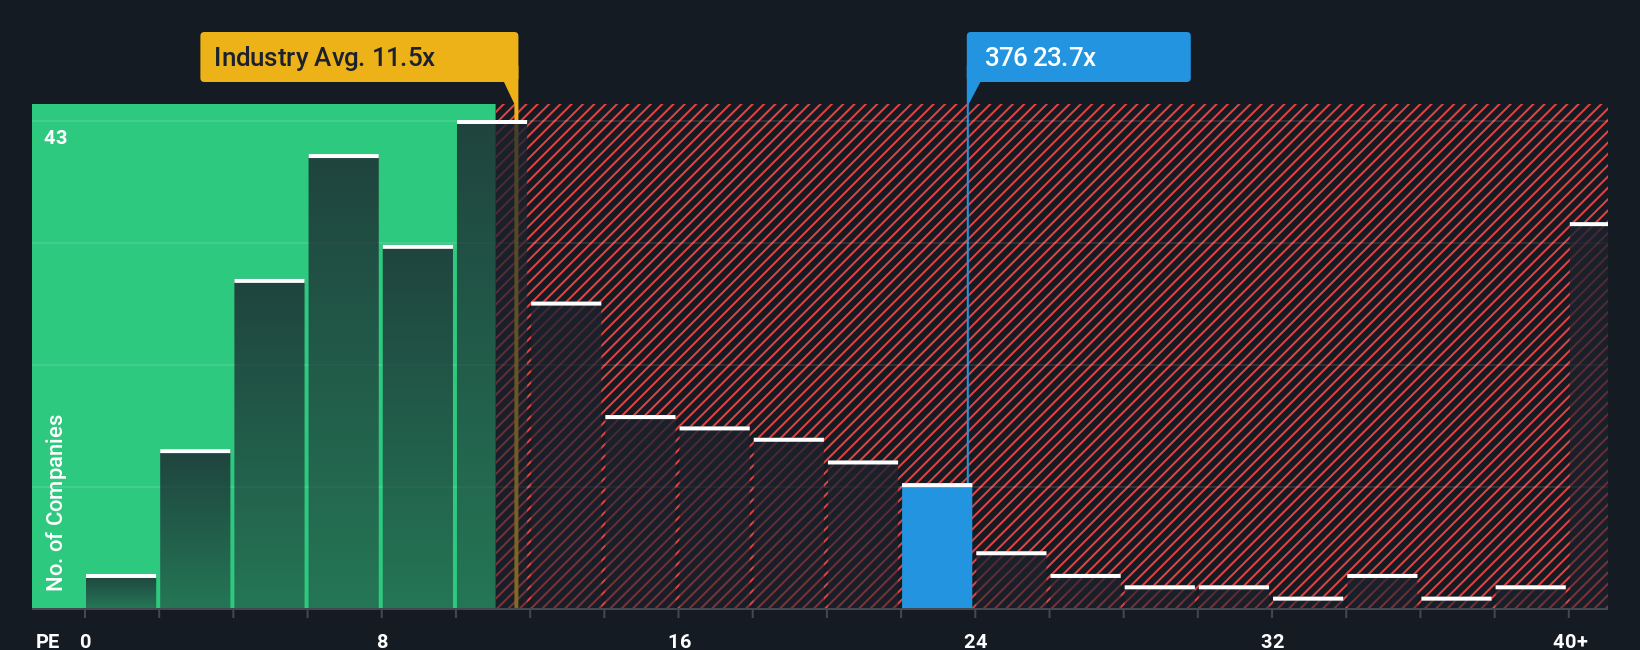
In spite of the heavy fall in price, Yunfeng Financial Group may still be sending very bearish signals at the moment with a price-to-earnings (or "P/E") ratio of 23.7x, since almost half of all companies in Hong Kong have P/E ratios under 12x and even P/E's lower than 7x are not unusual. Nonetheless, we'd need to dig a little deeper to determine if there is a rational basis for the highly elevated P/E.
Yunfeng Financial Group has been doing a good job lately as it's been growing earnings at a solid pace. It might be that many expect the respectable earnings performance to beat most other companies over the coming period, which has increased investors’ willingness to pay up for the stock. You'd really hope so, otherwise you're paying a pretty hefty price for no particular reason.
View our latest analysis for Yunfeng Financial Group
Does Growth Match The High P/E?
There's an inherent assumption that a company should far outperform the market for P/E ratios like Yunfeng Financial Group's to be considered reasonable.
If we review the last year of earnings growth, the company posted a terrific increase of 19%. Still, incredibly EPS has fallen 8.7% in total from three years ago, which is quite disappointing. Therefore, it's fair to say the earnings growth recently has been undesirable for the company.
Weighing that medium-term earnings trajectory against the broader market's one-year forecast for expansion of 21% shows it's an unpleasant look.
With this information, we find it concerning that Yunfeng Financial Group is trading at a P/E higher than the market. It seems most investors are ignoring the recent poor growth rate and are hoping for a turnaround in the company's business prospects. There's a very good chance existing shareholders are setting themselves up for future disappointment if the P/E falls to levels more in line with the recent negative growth rates.
What We Can Learn From Yunfeng Financial Group's P/E?
Even after such a strong price drop, Yunfeng Financial Group's P/E still exceeds the rest of the market significantly. We'd say the price-to-earnings ratio's power isn't primarily as a valuation instrument but rather to gauge current investor sentiment and future expectations.
We've established that Yunfeng Financial Group currently trades on a much higher than expected P/E since its recent earnings have been in decline over the medium-term. Right now we are increasingly uncomfortable with the high P/E as this earnings performance is highly unlikely to support such positive sentiment for long. Unless the recent medium-term conditions improve markedly, it's very challenging to accept these prices as being reasonable.
You should always think about risks. Case in point, we've spotted 2 warning signs for Yunfeng Financial Group you should be aware of.
You might be able to find a better investment than Yunfeng Financial Group. If you want a selection of possible candidates, check out this free list of interesting companies that trade on a low P/E (but have proven they can grow earnings).
New: Manage All Your Stock Portfolios in One Place
We've created the ultimate portfolio companion for stock investors, and it's free.
• Connect an unlimited number of Portfolios and see your total in one currency
• Be alerted to new Warning Signs or Risks via email or mobile
• Track the Fair Value of your stocks
Have feedback on this article? Concerned about the content? Get in touch with us directly. Alternatively, email editorial-team (at) simplywallst.com.
This article by Simply Wall St is general in nature. We provide commentary based on historical data and analyst forecasts only using an unbiased methodology and our articles are not intended to be financial advice. It does not constitute a recommendation to buy or sell any stock, and does not take account of your objectives, or your financial situation. We aim to bring you long-term focused analysis driven by fundamental data. Note that our analysis may not factor in the latest price-sensitive company announcements or qualitative material. Simply Wall St has no position in any stocks mentioned.
About SEHK:376
Yunfeng Financial Group
An investment holding company, provides insurance products in Hong Kong and Macao.
Excellent balance sheet with proven track record.
Market Insights

Advertisement
Community Narratives
Kodiak AI - a potential 100 bagger opportunity?
Fair Value US$14.00|44.7% undervalued
DA
Community Contributor
A Fair Price for a Great Business Facing Real Threats
Fair Value US$383.06|13.0% undervalued
IM
Community Contributor
AXON And Shopify Integration Will Unlock Global Mobile Advertising
Fair Value US$646.30|7.3% undervalued
AN
Based on Analyst Price Targets