
Advertisement
- Hong Kong
- /
- Personal Products
- /
- SEHK:8436
Takbo Group Holdings Limited's (HKG:8436) Shares Climb 26% But Its Business Is Yet to Catch Up
Takbo Group Holdings Limited (HKG:8436) shareholders have had their patience rewarded with a 26% share price jump in the last month. Unfortunately, the gains of the last month did little to right the losses of the last year with the stock still down 11% over that time.
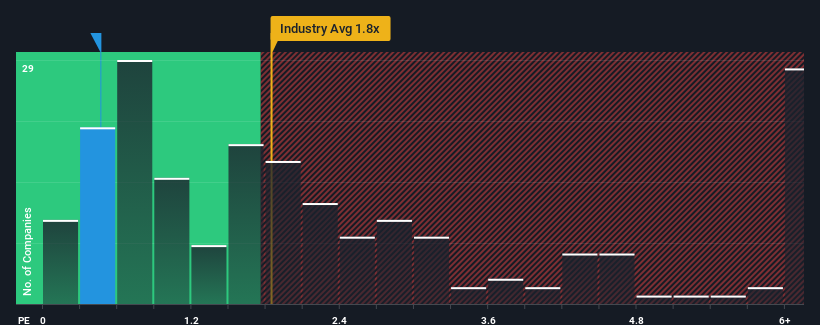
In spite of the firm bounce in price, there still wouldn't be many who think Takbo Group Holdings' price-to-sales (or "P/S") ratio of 0.5x is worth a mention when the median P/S in Hong Kong's Personal Products industry is similar at about 0.8x. Although, it's not wise to simply ignore the P/S without explanation as investors may be disregarding a distinct opportunity or a costly mistake.
View our latest analysis for Takbo Group Holdings
What Does Takbo Group Holdings' Recent Performance Look Like?
Revenue has risen at a steady rate over the last year for Takbo Group Holdings, which is generally not a bad outcome. It might be that many expect the respectable revenue performance to only match most other companies over the coming period, which has kept the P/S from rising. Those who are bullish on Takbo Group Holdings will be hoping that this isn't the case, so that they can pick up the stock at a lower valuation.
Although there are no analyst estimates available for Takbo Group Holdings, take a look at this free data-rich visualisation to see how the company stacks up on earnings, revenue and cash flow.What Are Revenue Growth Metrics Telling Us About The P/S?
There's an inherent assumption that a company should be matching the industry for P/S ratios like Takbo Group Holdings' to be considered reasonable.
If we review the last year of revenue growth, the company posted a worthy increase of 3.0%. However, this wasn't enough as the latest three year period has seen an unpleasant 25% overall drop in revenue. Therefore, it's fair to say the revenue growth recently has been undesirable for the company.
In contrast to the company, the rest of the industry is expected to grow by 30% over the next year, which really puts the company's recent medium-term revenue decline into perspective.
With this in mind, we find it worrying that Takbo Group Holdings' P/S exceeds that of its industry peers. It seems most investors are ignoring the recent poor growth rate and are hoping for a turnaround in the company's business prospects. Only the boldest would assume these prices are sustainable as a continuation of recent revenue trends is likely to weigh on the share price eventually.
The Key Takeaway
Takbo Group Holdings appears to be back in favour with a solid price jump bringing its P/S back in line with other companies in the industry While the price-to-sales ratio shouldn't be the defining factor in whether you buy a stock or not, it's quite a capable barometer of revenue expectations.
The fact that Takbo Group Holdings currently trades at a P/S on par with the rest of the industry is surprising to us since its recent revenues have been in decline over the medium-term, all while the industry is set to grow. When we see revenue heading backwards in the context of growing industry forecasts, it'd make sense to expect a possible share price decline on the horizon, sending the moderate P/S lower. Unless the the circumstances surrounding the recent medium-term improve, it wouldn't be wrong to expect a a difficult period ahead for the company's shareholders.
Don't forget that there may be other risks. For instance, we've identified 3 warning signs for Takbo Group Holdings (1 doesn't sit too well with us) you should be aware of.
If these risks are making you reconsider your opinion on Takbo Group Holdings, explore our interactive list of high quality stocks to get an idea of what else is out there.
Valuation is complex, but we're here to simplify it.
Discover if Takbo Group Holdings might be undervalued or overvalued with our detailed analysis, featuring fair value estimates, potential risks, dividends, insider trades, and its financial condition.
Access Free AnalysisHave feedback on this article? Concerned about the content? Get in touch with us directly. Alternatively, email editorial-team (at) simplywallst.com.
This article by Simply Wall St is general in nature. We provide commentary based on historical data and analyst forecasts only using an unbiased methodology and our articles are not intended to be financial advice. It does not constitute a recommendation to buy or sell any stock, and does not take account of your objectives, or your financial situation. We aim to bring you long-term focused analysis driven by fundamental data. Note that our analysis may not factor in the latest price-sensitive company announcements or qualitative material. Simply Wall St has no position in any stocks mentioned.
About SEHK:8436
Takbo Group Holdings
An investment holding company, designs, develops, manufactures, and sells beauty products in the United States, People’s Republic of China, Mexico, Belgium, Canada, the United Kingdom, Ireland, Hong Kong, and internationally.
Flawless balance sheet with slight risk.
Market Insights

Advertisement
Community Narratives
MicroVision will explode future revenue by 380.37% with a vision towards success
Fair Value US$60.00|98.5% undervalued
TH
Community Contributor
The Indispensable Artery for a New North American Economy
Fair Value CA$132.87|2.3% undervalued
TI
Community Contributor