
Advertisement
- Hong Kong
- /
- Household Products
- /
- SEHK:6993
Blue Moon Group Holdings (HKG:6993) Will Be Hoping To Turn Its Returns On Capital Around

What trends should we look for it we want to identify stocks that can multiply in value over the long term? Amongst other things, we'll want to see two things; firstly, a growing return on capital employed (ROCE) and secondly, an expansion in the company's amount of capital employed. Basically this means that a company has profitable initiatives that it can continue to reinvest in, which is a trait of a compounding machine. However, after investigating Blue Moon Group Holdings (HKG:6993), we don't think it's current trends fit the mold of a multi-bagger.
What Is Return On Capital Employed (ROCE)?
For those who don't know, ROCE is a measure of a company's yearly pre-tax profit (its return), relative to the capital employed in the business. To calculate this metric for Blue Moon Group Holdings, this is the formula:
Return on Capital Employed = Earnings Before Interest and Tax (EBIT) ÷ (Total Assets - Current Liabilities)
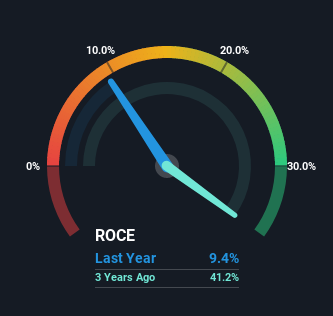
0.094 = HK$1.1b ÷ (HK$13b - HK$1.8b) (Based on the trailing twelve months to June 2022).
Therefore, Blue Moon Group Holdings has an ROCE of 9.4%. On its own that's a low return on capital but it's in line with the industry's average returns of 9.4%.
See our latest analysis for Blue Moon Group Holdings
Above you can see how the current ROCE for Blue Moon Group Holdings compares to its prior returns on capital, but there's only so much you can tell from the past. If you'd like to see what analysts are forecasting going forward, you should check out our free report for Blue Moon Group Holdings.
So How Is Blue Moon Group Holdings' ROCE Trending?
In terms of Blue Moon Group Holdings' historical ROCE movements, the trend isn't fantastic. To be more specific, ROCE has fallen from 23% over the last four years. However, given capital employed and revenue have both increased it appears that the business is currently pursuing growth, at the consequence of short term returns. And if the increased capital generates additional returns, the business, and thus shareholders, will benefit in the long run.
On a related note, Blue Moon Group Holdings has decreased its current liabilities to 13% of total assets. So we could link some of this to the decrease in ROCE. Effectively this means their suppliers or short-term creditors are funding less of the business, which reduces some elements of risk. Some would claim this reduces the business' efficiency at generating ROCE since it is now funding more of the operations with its own money.
What We Can Learn From Blue Moon Group Holdings' ROCE
In summary, despite lower returns in the short term, we're encouraged to see that Blue Moon Group Holdings is reinvesting for growth and has higher sales as a result. And there could be an opportunity here if other metrics look good too, because the stock has declined 27% in the last year. So we think it'd be worthwhile to look further into this stock given the trends look encouraging.
While Blue Moon Group Holdings doesn't shine too bright in this respect, it's still worth seeing if the company is trading at attractive prices. You can find that out with our FREE intrinsic value estimation on our platform.
While Blue Moon Group Holdings may not currently earn the highest returns, we've compiled a list of companies that currently earn more than 25% return on equity. Check out this free list here.
Valuation is complex, but we're here to simplify it.
Discover if Blue Moon Group Holdings might be undervalued or overvalued with our detailed analysis, featuring fair value estimates, potential risks, dividends, insider trades, and its financial condition.
Access Free AnalysisHave feedback on this article? Concerned about the content? Get in touch with us directly. Alternatively, email editorial-team (at) simplywallst.com.
This article by Simply Wall St is general in nature. We provide commentary based on historical data and analyst forecasts only using an unbiased methodology and our articles are not intended to be financial advice. It does not constitute a recommendation to buy or sell any stock, and does not take account of your objectives, or your financial situation. We aim to bring you long-term focused analysis driven by fundamental data. Note that our analysis may not factor in the latest price-sensitive company announcements or qualitative material. Simply Wall St has no position in any stocks mentioned.
About SEHK:6993
Blue Moon Group Holdings
Engages in the research, design, development, manufacture, and sale of personal hygiene, home care, and fabric care products in China.
Flawless balance sheet with moderate growth potential.
Market Insights

Advertisement
Community Narratives

BMW cruising ahead with new EVs and premium models to boost revenue 5%
Fair Value €135.07|44.6% undervalued
UN
Community Contributor
EU#2 - From Humble Beginnings to Global Powerhouse
Fair Value DKK 851.04|46.4% undervalued
TO
Community Contributor