- Hong Kong
- /
- Household Products
- /
- SEHK:6993
Blue Moon Group Holdings' (HKG:6993) Returns On Capital Not Reflecting Well On The Business


If we want to find a stock that could multiply over the long term, what are the underlying trends we should look for? Typically, we'll want to notice a trend of growing return on capital employed (ROCE) and alongside that, an expanding base of capital employed. Basically this means that a company has profitable initiatives that it can continue to reinvest in, which is a trait of a compounding machine. Having said that, from a first glance at Blue Moon Group Holdings (HKG:6993) we aren't jumping out of our chairs at how returns are trending, but let's have a deeper look.
What Is Return On Capital Employed (ROCE)?
For those who don't know, ROCE is a measure of a company's yearly pre-tax profit (its return), relative to the capital employed in the business. The formula for this calculation on Blue Moon Group Holdings is:
Return on Capital Employed = Earnings Before Interest and Tax (EBIT) ÷ (Total Assets - Current Liabilities)
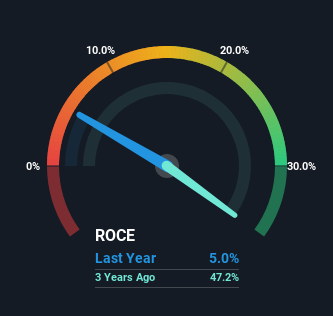
0.05 = HK$504m ÷ (HK$12b - HK$1.8b) (Based on the trailing twelve months to June 2023).
Therefore, Blue Moon Group Holdings has an ROCE of 5.0%. In absolute terms, that's a low return, but it's much better than the Household Products industry average of 2.8%.
Check out our latest analysis for Blue Moon Group Holdings
Above you can see how the current ROCE for Blue Moon Group Holdings compares to its prior returns on capital, but there's only so much you can tell from the past. If you'd like, you can check out the forecasts from the analysts covering Blue Moon Group Holdings here for free.
What Does the ROCE Trend For Blue Moon Group Holdings Tell Us?
On the surface, the trend of ROCE at Blue Moon Group Holdings doesn't inspire confidence. To be more specific, ROCE has fallen from 23% over the last five years. And considering revenue has dropped while employing more capital, we'd be cautious. This could mean that the business is losing its competitive advantage or market share, because while more money is being put into ventures, it's actually producing a lower return - "less bang for their buck" per se.
On a side note, Blue Moon Group Holdings has done well to pay down its current liabilities to 15% of total assets. So we could link some of this to the decrease in ROCE. Effectively this means their suppliers or short-term creditors are funding less of the business, which reduces some elements of risk. Since the business is basically funding more of its operations with it's own money, you could argue this has made the business less efficient at generating ROCE.
The Bottom Line
In summary, we're somewhat concerned by Blue Moon Group Holdings' diminishing returns on increasing amounts of capital. We expect this has contributed to the stock plummeting 88% during the last three years. With underlying trends that aren't great in these areas, we'd consider looking elsewhere.
One more thing, we've spotted 1 warning sign facing Blue Moon Group Holdings that you might find interesting.
While Blue Moon Group Holdings may not currently earn the highest returns, we've compiled a list of companies that currently earn more than 25% return on equity. Check out this free list here.
Valuation is complex, but we're here to simplify it.
Discover if Blue Moon Group Holdings might be undervalued or overvalued with our detailed analysis, featuring fair value estimates, potential risks, dividends, insider trades, and its financial condition.
Access Free AnalysisHave feedback on this article? Concerned about the content? Get in touch with us directly. Alternatively, email editorial-team (at) simplywallst.com.
This article by Simply Wall St is general in nature. We provide commentary based on historical data and analyst forecasts only using an unbiased methodology and our articles are not intended to be financial advice. It does not constitute a recommendation to buy or sell any stock, and does not take account of your objectives, or your financial situation. We aim to bring you long-term focused analysis driven by fundamental data. Note that our analysis may not factor in the latest price-sensitive company announcements or qualitative material. Simply Wall St has no position in any stocks mentioned.
About SEHK:6993
Blue Moon Group Holdings
Engages in the research, design, development, manufacture, and sale of personal hygiene, home care, and fabric care products in China.
Flawless balance sheet with moderate growth potential.
Market Insights

Community Narratives

