- Hong Kong
- /
- Household Products
- /
- SEHK:6993
After Leaping 27% Blue Moon Group Holdings Limited (HKG:6993) Shares Are Not Flying Under The Radar


Blue Moon Group Holdings Limited (HKG:6993) shares have had a really impressive month, gaining 27% after a shaky period beforehand. Unfortunately, the gains of the last month did little to right the losses of the last year with the stock still down 18% over that time.
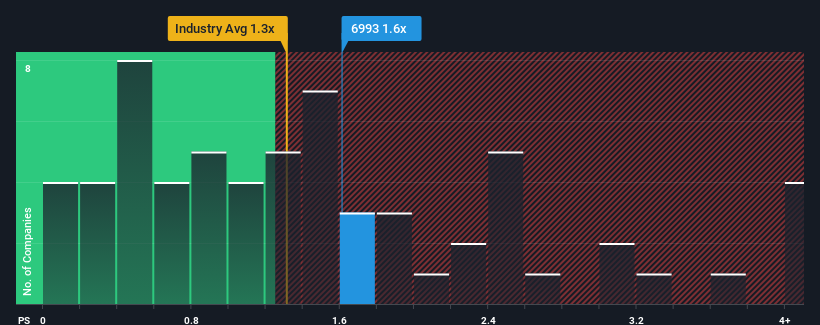
After such a large jump in price, given close to half the companies operating in Hong Kong's Household Products industry have price-to-sales ratios (or "P/S") below 0.5x, you may consider Blue Moon Group Holdings as a stock to potentially avoid with its 1.6x P/S ratio. Although, it's not wise to just take the P/S at face value as there may be an explanation why it's as high as it is.
See our latest analysis for Blue Moon Group Holdings
How Has Blue Moon Group Holdings Performed Recently?
There hasn't been much to differentiate Blue Moon Group Holdings' and the industry's revenue growth lately. One possibility is that the P/S ratio is high because investors think this modest revenue performance will accelerate. You'd really hope so, otherwise you're paying a pretty hefty price for no particular reason.
If you'd like to see what analysts are forecasting going forward, you should check out our free report on Blue Moon Group Holdings.How Is Blue Moon Group Holdings' Revenue Growth Trending?
There's an inherent assumption that a company should outperform the industry for P/S ratios like Blue Moon Group Holdings' to be considered reasonable.
If we review the last year of revenue growth, the company posted a worthy increase of 13%. The solid recent performance means it was also able to grow revenue by 19% in total over the last three years. Accordingly, shareholders would have probably been satisfied with the medium-term rates of revenue growth.
Looking ahead now, revenue is anticipated to climb by 7.9% per annum during the coming three years according to the six analysts following the company. With the industry only predicted to deliver 5.1% per annum, the company is positioned for a stronger revenue result.
With this in mind, it's not hard to understand why Blue Moon Group Holdings' P/S is high relative to its industry peers. Apparently shareholders aren't keen to offload something that is potentially eyeing a more prosperous future.
The Key Takeaway
The large bounce in Blue Moon Group Holdings' shares has lifted the company's P/S handsomely. Using the price-to-sales ratio alone to determine if you should sell your stock isn't sensible, however it can be a practical guide to the company's future prospects.
As we suspected, our examination of Blue Moon Group Holdings' analyst forecasts revealed that its superior revenue outlook is contributing to its high P/S. It appears that shareholders are confident in the company's future revenues, which is propping up the P/S. Unless these conditions change, they will continue to provide strong support to the share price.
The company's balance sheet is another key area for risk analysis. Take a look at our free balance sheet analysis for Blue Moon Group Holdings with six simple checks on some of these key factors.
It's important to make sure you look for a great company, not just the first idea you come across. So if growing profitability aligns with your idea of a great company, take a peek at this free list of interesting companies with strong recent earnings growth (and a low P/E).
If you're looking to trade Blue Moon Group Holdings, open an account with the lowest-cost platform trusted by professionals, Interactive Brokers.
With clients in over 200 countries and territories, and access to 160 markets, IBKR lets you trade stocks, options, futures, forex, bonds and funds from a single integrated account.
Enjoy no hidden fees, no account minimums, and FX conversion rates as low as 0.03%, far better than what most brokers offer.
Sponsored ContentValuation is complex, but we're here to simplify it.
Discover if Blue Moon Group Holdings might be undervalued or overvalued with our detailed analysis, featuring fair value estimates, potential risks, dividends, insider trades, and its financial condition.
Access Free AnalysisHave feedback on this article? Concerned about the content? Get in touch with us directly. Alternatively, email editorial-team (at) simplywallst.com.
This article by Simply Wall St is general in nature. We provide commentary based on historical data and analyst forecasts only using an unbiased methodology and our articles are not intended to be financial advice. It does not constitute a recommendation to buy or sell any stock, and does not take account of your objectives, or your financial situation. We aim to bring you long-term focused analysis driven by fundamental data. Note that our analysis may not factor in the latest price-sensitive company announcements or qualitative material. Simply Wall St has no position in any stocks mentioned.
About SEHK:6993
Blue Moon Group Holdings
Engages in the research, design, development, manufacture, and sale of personal hygiene, home care, and fabric care products in China.
Flawless balance sheet with moderate growth potential.
Market Insights

Community Narratives

