- Hong Kong
- /
- Household Products
- /
- SEHK:3331
The five-year decline in earnings for Vinda International Holdings HKG:3331) isn't encouraging, but shareholders are still up 67% over that period


Stock pickers are generally looking for stocks that will outperform the broader market. And while active stock picking involves risks (and requires diversification) it can also provide excess returns. To wit, the Vinda International Holdings share price has climbed 52% in five years, easily topping the market decline of 21% (ignoring dividends). On the other hand, the more recent gains haven't been so impressive, with shareholders gaining just 9.6% , including dividends .
While this past week has detracted from the company's five-year return, let's look at the recent trends of the underlying business and see if the gains have been in alignment.
View our latest analysis for Vinda International Holdings
In his essay The Superinvestors of Graham-and-Doddsville Warren Buffett described how share prices do not always rationally reflect the value of a business. One flawed but reasonable way to assess how sentiment around a company has changed is to compare the earnings per share (EPS) with the share price.
During five years of share price growth, Vinda International Holdings actually saw its EPS drop 24% per year.
This means it's unlikely the market is judging the company based on earnings growth. Because earnings per share don't seem to match up with the share price, we'll take a look at other metrics instead.
In contrast revenue growth of 6.8% per year is probably viewed as evidence that Vinda International Holdings is growing, a real positive. It's quite possible that management are prioritizing revenue growth over EPS growth at the moment.
You can see how earnings and revenue have changed over time in the image below (click on the chart to see the exact values).
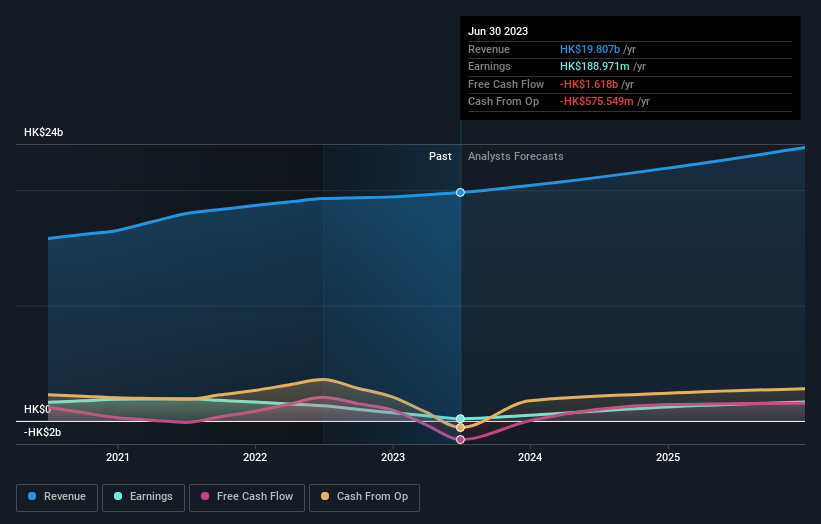
It's probably worth noting we've seen significant insider buying in the last quarter, which we consider a positive. On the other hand, we think the revenue and earnings trends are much more meaningful measures of the business. You can see what analysts are predicting for Vinda International Holdings in this interactive graph of future profit estimates.
What About Dividends?
It is important to consider the total shareholder return, as well as the share price return, for any given stock. The TSR is a return calculation that accounts for the value of cash dividends (assuming that any dividend received was reinvested) and the calculated value of any discounted capital raisings and spin-offs. Arguably, the TSR gives a more comprehensive picture of the return generated by a stock. In the case of Vinda International Holdings, it has a TSR of 67% for the last 5 years. That exceeds its share price return that we previously mentioned. And there's no prize for guessing that the dividend payments largely explain the divergence!
A Different Perspective
Vinda International Holdings provided a TSR of 9.6% over the year (including dividends). That's fairly close to the broader market return. We should note here that the five-year TSR is more impressive, at 11% per year. More recently, the share price growth has slowed. But it has to be said the overall picture is one of good long term and short term performance. Arguably that makes Vinda International Holdings a stock worth watching. I find it very interesting to look at share price over the long term as a proxy for business performance. But to truly gain insight, we need to consider other information, too. For example, we've discovered 2 warning signs for Vinda International Holdings (1 is significant!) that you should be aware of before investing here.
There are plenty of other companies that have insiders buying up shares. You probably do not want to miss this free list of growing companies that insiders are buying.
Please note, the market returns quoted in this article reflect the market weighted average returns of stocks that currently trade on Hong Kong exchanges.
New: Manage All Your Stock Portfolios in One Place
We've created the ultimate portfolio companion for stock investors, and it's free.
• Connect an unlimited number of Portfolios and see your total in one currency
• Be alerted to new Warning Signs or Risks via email or mobile
• Track the Fair Value of your stocks
Have feedback on this article? Concerned about the content? Get in touch with us directly. Alternatively, email editorial-team (at) simplywallst.com.
This article by Simply Wall St is general in nature. We provide commentary based on historical data and analyst forecasts only using an unbiased methodology and our articles are not intended to be financial advice. It does not constitute a recommendation to buy or sell any stock, and does not take account of your objectives, or your financial situation. We aim to bring you long-term focused analysis driven by fundamental data. Note that our analysis may not factor in the latest price-sensitive company announcements or qualitative material. Simply Wall St has no position in any stocks mentioned.
About SEHK:3331
Vinda International Holdings
Vinda International Holdings Limited, an investment holding company, manufactures and sells household paper and personal care products in Mainland China, Hong Kong, Malaysia, Japan, Taiwan, and internationally.
Flawless balance sheet with moderate growth potential.
Market Insights

Community Narratives

