- Hong Kong
- /
- Personal Products
- /
- SEHK:1259
Prosperous Future Holdings Limited's (HKG:1259) Share Price Boosted 25% But Its Business Prospects Need A Lift Too


Prosperous Future Holdings Limited (HKG:1259) shares have continued their recent momentum with a 25% gain in the last month alone. Unfortunately, despite the strong performance over the last month, the full year gain of 6.7% isn't as attractive.
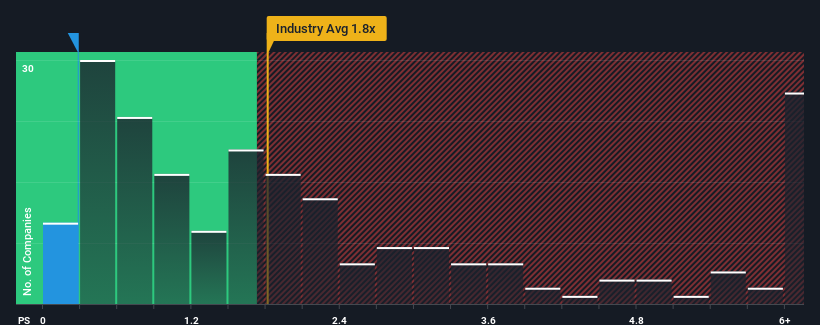
Even after such a large jump in price, Prosperous Future Holdings may still be sending bullish signals at the moment with its price-to-sales (or "P/S") ratio of 0.3x, since almost half of all companies in the Personal Products industry in Hong Kong have P/S ratios greater than 0.9x and even P/S higher than 3x are not unusual. Although, it's not wise to just take the P/S at face value as there may be an explanation why it's limited.
Check out our latest analysis for Prosperous Future Holdings
How Has Prosperous Future Holdings Performed Recently?
Recent times have been quite advantageous for Prosperous Future Holdings as its revenue has been rising very briskly. One possibility is that the P/S ratio is low because investors think this strong revenue growth might actually underperform the broader industry in the near future. If you like the company, you'd be hoping this isn't the case so that you could potentially pick up some stock while it's out of favour.
Want the full picture on earnings, revenue and cash flow for the company? Then our free report on Prosperous Future Holdings will help you shine a light on its historical performance.What Are Revenue Growth Metrics Telling Us About The Low P/S?
Prosperous Future Holdings' P/S ratio would be typical for a company that's only expected to deliver limited growth, and importantly, perform worse than the industry.
Retrospectively, the last year delivered an exceptional 36% gain to the company's top line. However, this wasn't enough as the latest three year period has seen the company endure a nasty 53% drop in revenue in aggregate. Accordingly, shareholders would have felt downbeat about the medium-term rates of revenue growth.
Comparing that to the industry, which is predicted to deliver 10.0% growth in the next 12 months, the company's downward momentum based on recent medium-term revenue results is a sobering picture.
With this information, we are not surprised that Prosperous Future Holdings is trading at a P/S lower than the industry. Nonetheless, there's no guarantee the P/S has reached a floor yet with revenue going in reverse. Even just maintaining these prices could be difficult to achieve as recent revenue trends are already weighing down the shares.
The Final Word
The latest share price surge wasn't enough to lift Prosperous Future Holdings' P/S close to the industry median. Using the price-to-sales ratio alone to determine if you should sell your stock isn't sensible, however it can be a practical guide to the company's future prospects.
As we suspected, our examination of Prosperous Future Holdings revealed its shrinking revenue over the medium-term is contributing to its low P/S, given the industry is set to grow. At this stage investors feel the potential for an improvement in revenue isn't great enough to justify a higher P/S ratio. Given the current circumstances, it seems unlikely that the share price will experience any significant movement in either direction in the near future if recent medium-term revenue trends persist.
It's always necessary to consider the ever-present spectre of investment risk. We've identified 2 warning signs with Prosperous Future Holdings (at least 1 which shouldn't be ignored), and understanding these should be part of your investment process.
Of course, profitable companies with a history of great earnings growth are generally safer bets. So you may wish to see this free collection of other companies that have reasonable P/E ratios and have grown earnings strongly.
If you're looking to trade Prosperous Future Holdings, open an account with the lowest-cost platform trusted by professionals, Interactive Brokers.
With clients in over 200 countries and territories, and access to 160 markets, IBKR lets you trade stocks, options, futures, forex, bonds and funds from a single integrated account.
Enjoy no hidden fees, no account minimums, and FX conversion rates as low as 0.03%, far better than what most brokers offer.
Sponsored ContentNew: Manage All Your Stock Portfolios in One Place
We've created the ultimate portfolio companion for stock investors, and it's free.
• Connect an unlimited number of Portfolios and see your total in one currency
• Be alerted to new Warning Signs or Risks via email or mobile
• Track the Fair Value of your stocks
Have feedback on this article? Concerned about the content? Get in touch with us directly. Alternatively, email editorial-team (at) simplywallst.com.
This article by Simply Wall St is general in nature. We provide commentary based on historical data and analyst forecasts only using an unbiased methodology and our articles are not intended to be financial advice. It does not constitute a recommendation to buy or sell any stock, and does not take account of your objectives, or your financial situation. We aim to bring you long-term focused analysis driven by fundamental data. Note that our analysis may not factor in the latest price-sensitive company announcements or qualitative material. Simply Wall St has no position in any stocks mentioned.
About SEHK:1259
Prosperous Future Holdings
An investment holding company, engages in selling of frozen food and beverage products in Hong Kong and internationally.
Flawless balance sheet and good value.
Market Insights

Community Narratives

