- Hong Kong
- /
- Personal Products
- /
- SEHK:1044
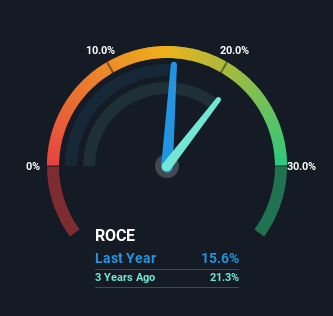
Returns On Capital Signal Difficult Times Ahead For Hengan International Group (HKG:1044)


What underlying fundamental trends can indicate that a company might be in decline? Businesses in decline often have two underlying trends, firstly, a declining return on capital employed (ROCE) and a declining base of capital employed. This indicates the company is producing less profit from its investments and its total assets are decreasing. So after glancing at the trends within Hengan International Group (HKG:1044), we weren't too hopeful.
What Is Return On Capital Employed (ROCE)?
If you haven't worked with ROCE before, it measures the 'return' (pre-tax profit) a company generates from capital employed in its business. Analysts use this formula to calculate it for Hengan International Group:
Return on Capital Employed = Earnings Before Interest and Tax (EBIT) ÷ (Total Assets - Current Liabilities)
0.16 = CN¥3.7b ÷ (CN¥46b - CN¥23b) (Based on the trailing twelve months to June 2024).
Therefore, Hengan International Group has an ROCE of 16%. That's a relatively normal return on capital, and it's around the 13% generated by the Personal Products industry.
Check out our latest analysis for Hengan International Group
Above you can see how the current ROCE for Hengan International Group compares to its prior returns on capital, but there's only so much you can tell from the past. If you're interested, you can view the analysts predictions in our free analyst report for Hengan International Group .
How Are Returns Trending?
We are a bit worried about the trend of returns on capital at Hengan International Group. To be more specific, the ROCE was 22% five years ago, but since then it has dropped noticeably. And on the capital employed front, the business is utilizing roughly the same amount of capital as it was back then. This combination can be indicative of a mature business that still has areas to deploy capital, but the returns received aren't as high due potentially to new competition or smaller margins. So because these trends aren't typically conducive to creating a multi-bagger, we wouldn't hold our breath on Hengan International Group becoming one if things continue as they have.
Another thing to note, Hengan International Group has a high ratio of current liabilities to total assets of 49%. This can bring about some risks because the company is basically operating with a rather large reliance on its suppliers or other sorts of short-term creditors. Ideally we'd like to see this reduce as that would mean fewer obligations bearing risks.
The Key Takeaway
All in all, the lower returns from the same amount of capital employed aren't exactly signs of a compounding machine. Investors haven't taken kindly to these developments, since the stock has declined 44% from where it was five years ago. That being the case, unless the underlying trends revert to a more positive trajectory, we'd consider looking elsewhere.
If you'd like to know about the risks facing Hengan International Group, we've discovered 1 warning sign that you should be aware of.
For those who like to invest in solid companies, check out this free list of companies with solid balance sheets and high returns on equity.
If you're looking to trade Hengan International Group, open an account with the lowest-cost platform trusted by professionals, Interactive Brokers.
With clients in over 200 countries and territories, and access to 160 markets, IBKR lets you trade stocks, options, futures, forex, bonds and funds from a single integrated account.
Enjoy no hidden fees, no account minimums, and FX conversion rates as low as 0.03%, far better than what most brokers offer.
Sponsored ContentValuation is complex, but we're here to simplify it.
Discover if Hengan International Group might be undervalued or overvalued with our detailed analysis, featuring fair value estimates, potential risks, dividends, insider trades, and its financial condition.
Access Free AnalysisHave feedback on this article? Concerned about the content? Get in touch with us directly. Alternatively, email editorial-team (at) simplywallst.com.
This article by Simply Wall St is general in nature. We provide commentary based on historical data and analyst forecasts only using an unbiased methodology and our articles are not intended to be financial advice. It does not constitute a recommendation to buy or sell any stock, and does not take account of your objectives, or your financial situation. We aim to bring you long-term focused analysis driven by fundamental data. Note that our analysis may not factor in the latest price-sensitive company announcements or qualitative material. Simply Wall St has no position in any stocks mentioned.
About SEHK:1044
Hengan International Group
An investment holding company, manufactures, distributes, and sells personal hygiene products in the People’s Republic of China and internationally.
Flawless balance sheet and undervalued.
Market Insights

Community Narratives

