- Hong Kong
- /
- Personal Products
- /
- SEHK:1044
Investors Could Be Concerned With Hengan International Group's (HKG:1044) Returns On Capital


When it comes to investing, there are some useful financial metrics that can warn us when a business is potentially in trouble. Typically, we'll see the trend of both return on capital employed (ROCE) declining and this usually coincides with a decreasing amount of capital employed. This indicates to us that the business is not only shrinking the size of its net assets, but its returns are falling as well. And from a first read, things don't look too good at Hengan International Group (HKG:1044), so let's see why.
What Is Return On Capital Employed (ROCE)?
Just to clarify if you're unsure, ROCE is a metric for evaluating how much pre-tax income (in percentage terms) a company earns on the capital invested in its business. Analysts use this formula to calculate it for Hengan International Group:
Return on Capital Employed = Earnings Before Interest and Tax (EBIT) ÷ (Total Assets - Current Liabilities)
0.17 = CN¥3.5b ÷ (CN¥40b - CN¥19b) (Based on the trailing twelve months to December 2023).
So, Hengan International Group has an ROCE of 17%. On its own, that's a standard return, however it's much better than the 12% generated by the Personal Products industry.
See our latest analysis for Hengan International Group
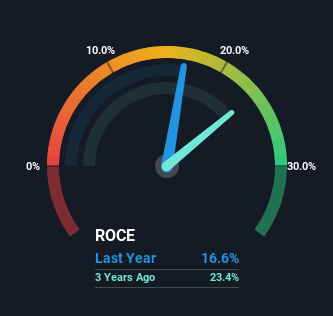
Above you can see how the current ROCE for Hengan International Group compares to its prior returns on capital, but there's only so much you can tell from the past. If you're interested, you can view the analysts predictions in our free analyst report for Hengan International Group .
What The Trend Of ROCE Can Tell Us
We are a bit worried about the trend of returns on capital at Hengan International Group. Unfortunately the returns on capital have diminished from the 23% that they were earning five years ago. Meanwhile, capital employed in the business has stayed roughly the flat over the period. This combination can be indicative of a mature business that still has areas to deploy capital, but the returns received aren't as high due potentially to new competition or smaller margins. If these trends continue, we wouldn't expect Hengan International Group to turn into a multi-bagger.
On a separate but related note, it's important to know that Hengan International Group has a current liabilities to total assets ratio of 47%, which we'd consider pretty high. This effectively means that suppliers (or short-term creditors) are funding a large portion of the business, so just be aware that this can introduce some elements of risk. Ideally we'd like to see this reduce as that would mean fewer obligations bearing risks.
What We Can Learn From Hengan International Group's ROCE
In the end, the trend of lower returns on the same amount of capital isn't typically an indication that we're looking at a growth stock. It should come as no surprise then that the stock has fallen 40% over the last five years, so it looks like investors are recognizing these changes. That being the case, unless the underlying trends revert to a more positive trajectory, we'd consider looking elsewhere.
If you want to continue researching Hengan International Group, you might be interested to know about the 1 warning sign that our analysis has discovered.
While Hengan International Group isn't earning the highest return, check out this free list of companies that are earning high returns on equity with solid balance sheets.
If you're looking to trade Hengan International Group, open an account with the lowest-cost platform trusted by professionals, Interactive Brokers.
With clients in over 200 countries and territories, and access to 160 markets, IBKR lets you trade stocks, options, futures, forex, bonds and funds from a single integrated account.
Enjoy no hidden fees, no account minimums, and FX conversion rates as low as 0.03%, far better than what most brokers offer.
Sponsored ContentValuation is complex, but we're here to simplify it.
Discover if Hengan International Group might be undervalued or overvalued with our detailed analysis, featuring fair value estimates, potential risks, dividends, insider trades, and its financial condition.
Access Free AnalysisHave feedback on this article? Concerned about the content? Get in touch with us directly. Alternatively, email editorial-team (at) simplywallst.com.
This article by Simply Wall St is general in nature. We provide commentary based on historical data and analyst forecasts only using an unbiased methodology and our articles are not intended to be financial advice. It does not constitute a recommendation to buy or sell any stock, and does not take account of your objectives, or your financial situation. We aim to bring you long-term focused analysis driven by fundamental data. Note that our analysis may not factor in the latest price-sensitive company announcements or qualitative material. Simply Wall St has no position in any stocks mentioned.
About SEHK:1044
Hengan International Group
An investment holding company, manufactures, distributes, and sells personal hygiene products in the People’s Republic of China and internationally.
Flawless balance sheet and undervalued.
Market Insights

Community Narratives

