- Hong Kong
- /
- Personal Products
- /
- SEHK:1044
Hengan International Group (HKG:1044) Could Be Struggling To Allocate Capital


If we're looking to avoid a business that is in decline, what are the trends that can warn us ahead of time? When we see a declining return on capital employed (ROCE) in conjunction with a declining base of capital employed, that's often how a mature business shows signs of aging. This indicates the company is producing less profit from its investments and its total assets are decreasing. On that note, looking into Hengan International Group (HKG:1044), we weren't too upbeat about how things were going.
Understanding Return On Capital Employed (ROCE)
Just to clarify if you're unsure, ROCE is a metric for evaluating how much pre-tax income (in percentage terms) a company earns on the capital invested in its business. To calculate this metric for Hengan International Group, this is the formula:
Return on Capital Employed = Earnings Before Interest and Tax (EBIT) ÷ (Total Assets - Current Liabilities)
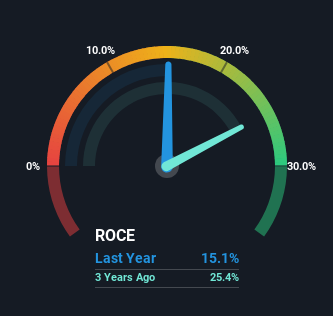
0.15 = CN¥3.1b ÷ (CN¥48b - CN¥28b) (Based on the trailing twelve months to June 2023).
So, Hengan International Group has an ROCE of 15%. That's a relatively normal return on capital, and it's around the 13% generated by the Personal Products industry.
Check out our latest analysis for Hengan International Group
Above you can see how the current ROCE for Hengan International Group compares to its prior returns on capital, but there's only so much you can tell from the past. If you'd like to see what analysts are forecasting going forward, you should check out our free report for Hengan International Group.
How Are Returns Trending?
In terms of Hengan International Group's historical ROCE movements, the trend doesn't inspire confidence. To be more specific, the ROCE was 23% five years ago, but since then it has dropped noticeably. Meanwhile, capital employed in the business has stayed roughly the flat over the period. Companies that exhibit these attributes tend to not be shrinking, but they can be mature and facing pressure on their margins from competition. So because these trends aren't typically conducive to creating a multi-bagger, we wouldn't hold our breath on Hengan International Group becoming one if things continue as they have.
While on the subject, we noticed that the ratio of current liabilities to total assets has risen to 57%, which has impacted the ROCE. Without this increase, it's likely that ROCE would be even lower than 15%. And with current liabilities at these levels, suppliers or short-term creditors are effectively funding a large part of the business, which can introduce some risks.
In Conclusion...
In summary, it's unfortunate that Hengan International Group is generating lower returns from the same amount of capital. Investors haven't taken kindly to these developments, since the stock has declined 43% from where it was five years ago. That being the case, unless the underlying trends revert to a more positive trajectory, we'd consider looking elsewhere.
On a final note, we've found 2 warning signs for Hengan International Group that we think you should be aware of.
If you want to search for solid companies with great earnings, check out this free list of companies with good balance sheets and impressive returns on equity.
Valuation is complex, but we're here to simplify it.
Discover if Hengan International Group might be undervalued or overvalued with our detailed analysis, featuring fair value estimates, potential risks, dividends, insider trades, and its financial condition.
Access Free AnalysisHave feedback on this article? Concerned about the content? Get in touch with us directly. Alternatively, email editorial-team (at) simplywallst.com.
This article by Simply Wall St is general in nature. We provide commentary based on historical data and analyst forecasts only using an unbiased methodology and our articles are not intended to be financial advice. It does not constitute a recommendation to buy or sell any stock, and does not take account of your objectives, or your financial situation. We aim to bring you long-term focused analysis driven by fundamental data. Note that our analysis may not factor in the latest price-sensitive company announcements or qualitative material. Simply Wall St has no position in any stocks mentioned.
About SEHK:1044
Hengan International Group
An investment holding company, manufactures, distributes, and sells personal hygiene products in the People’s Republic of China and internationally.
Undervalued with excellent balance sheet.
Market Insights

Community Narratives


