- Hong Kong
- /
- Healthcare Services
- /
- SEHK:401
Slammed 36% Wanjia Group Holdings Limited (HKG:401) Screens Well Here But There Might Be A Catch


The Wanjia Group Holdings Limited (HKG:401) share price has fared very poorly over the last month, falling by a substantial 36%. For any long-term shareholders, the last month ends a year to forget by locking in a 65% share price decline.
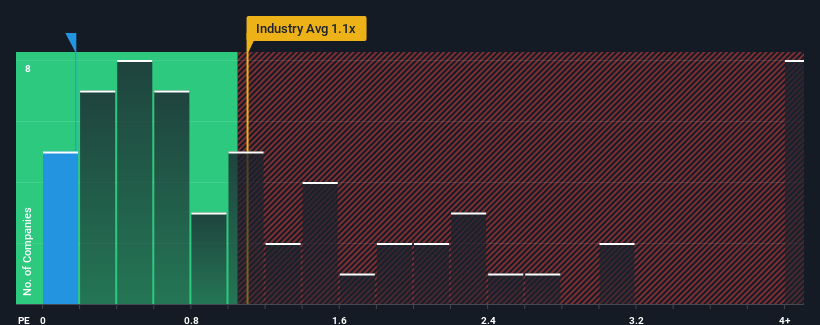
In spite of the heavy fall in price, it would still be understandable if you think Wanjia Group Holdings is a stock with good investment prospects with a price-to-sales ratios (or "P/S") of 0.2x, considering almost half the companies in Hong Kong's Healthcare industry have P/S ratios above 1.1x. Although, it's not wise to just take the P/S at face value as there may be an explanation why it's limited.
Check out our latest analysis for Wanjia Group Holdings
How Has Wanjia Group Holdings Performed Recently?
It looks like revenue growth has deserted Wanjia Group Holdings recently, which is not something to boast about. Perhaps the market believes the recent lacklustre revenue performance is a sign of future underperformance relative to industry peers, hurting the P/S. If not, then existing shareholders may be feeling optimistic about the future direction of the share price.
We don't have analyst forecasts, but you can see how recent trends are setting up the company for the future by checking out our free report on Wanjia Group Holdings' earnings, revenue and cash flow.What Are Revenue Growth Metrics Telling Us About The Low P/S?
There's an inherent assumption that a company should underperform the industry for P/S ratios like Wanjia Group Holdings' to be considered reasonable.
Retrospectively, the last year delivered virtually the same number to the company's top line as the year before. However, a few strong years before that means that it was still able to grow revenue by an impressive 83% in total over the last three years. Therefore, it's fair to say the revenue growth recently has been great for the company, but investors will want to ask why it has slowed to such an extent.
Comparing that recent medium-term revenue trajectory with the industry's one-year growth forecast of 16% shows it's noticeably more attractive.
In light of this, it's peculiar that Wanjia Group Holdings' P/S sits below the majority of other companies. Apparently some shareholders believe the recent performance has exceeded its limits and have been accepting significantly lower selling prices.
The Key Takeaway
Wanjia Group Holdings' P/S has taken a dip along with its share price. While the price-to-sales ratio shouldn't be the defining factor in whether you buy a stock or not, it's quite a capable barometer of revenue expectations.
We're very surprised to see Wanjia Group Holdings currently trading on a much lower than expected P/S since its recent three-year growth is higher than the wider industry forecast. When we see strong revenue with faster-than-industry growth, we assume there are some significant underlying risks to the company's ability to make money which is applying downwards pressure on the P/S ratio. It appears many are indeed anticipating revenue instability, because the persistence of these recent medium-term conditions would normally provide a boost to the share price.
It is also worth noting that we have found 3 warning signs for Wanjia Group Holdings (1 doesn't sit too well with us!) that you need to take into consideration.
If strong companies turning a profit tickle your fancy, then you'll want to check out this free list of interesting companies that trade on a low P/E (but have proven they can grow earnings).
If you're looking to trade Wanjia Group Holdings, open an account with the lowest-cost platform trusted by professionals, Interactive Brokers.
With clients in over 200 countries and territories, and access to 160 markets, IBKR lets you trade stocks, options, futures, forex, bonds and funds from a single integrated account.
Enjoy no hidden fees, no account minimums, and FX conversion rates as low as 0.03%, far better than what most brokers offer.
Sponsored ContentValuation is complex, but we're here to simplify it.
Discover if Wanjia Group Holdings might be undervalued or overvalued with our detailed analysis, featuring fair value estimates, potential risks, dividends, insider trades, and its financial condition.
Access Free AnalysisHave feedback on this article? Concerned about the content? Get in touch with us directly. Alternatively, email editorial-team (at) simplywallst.com.
This article by Simply Wall St is general in nature. We provide commentary based on historical data and analyst forecasts only using an unbiased methodology and our articles are not intended to be financial advice. It does not constitute a recommendation to buy or sell any stock, and does not take account of your objectives, or your financial situation. We aim to bring you long-term focused analysis driven by fundamental data. Note that our analysis may not factor in the latest price-sensitive company announcements or qualitative material. Simply Wall St has no position in any stocks mentioned.
About SEHK:401
Wanjia Group Holdings
An investment holding company, engages in pharmaceutical wholesale and distribution business in the Mainland China and Hong Kong.
Flawless balance sheet low.

