
Advertisement
- Hong Kong
- /
- Healthcare Services
- /
- SEHK:3869
Hospital Corporation of China Limited (HKG:3869) Stock Rockets 33% But Many Are Still Ignoring The Company

Hospital Corporation of China Limited (HKG:3869) shareholders are no doubt pleased to see that the share price has bounced 33% in the last month, although it is still struggling to make up recently lost ground. Unfortunately, despite the strong performance over the last month, the full year gain of 5.0% isn't as attractive.
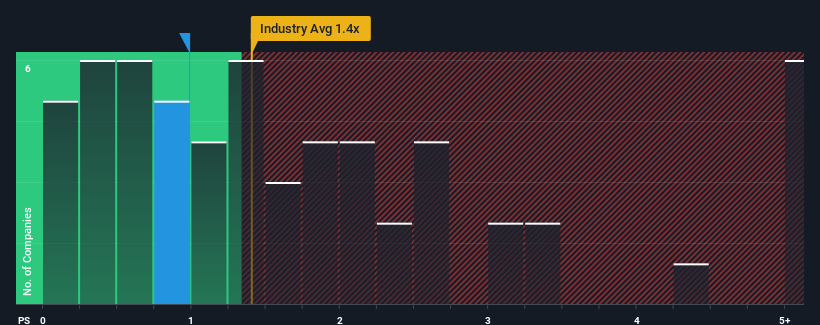
Even after such a large jump in price, it's still not a stretch to say that Hospital Corporation of China's price-to-sales (or "P/S") ratio of 1x right now seems quite "middle-of-the-road" compared to the Healthcare industry in Hong Kong, where the median P/S ratio is around 1.4x. While this might not raise any eyebrows, if the P/S ratio is not justified investors could be missing out on a potential opportunity or ignoring looming disappointment.
Check out our latest analysis for Hospital Corporation of China
What Does Hospital Corporation of China's Recent Performance Look Like?
Recent times have been quite advantageous for Hospital Corporation of China as its revenue has been rising very briskly. The P/S is probably moderate because investors think this strong revenue growth might not be enough to outperform the broader industry in the near future. If you like the company, you'd be hoping this isn't the case so that you could potentially pick up some stock while it's not quite in favour.
We don't have analyst forecasts, but you can see how recent trends are setting up the company for the future by checking out our free report on Hospital Corporation of China's earnings, revenue and cash flow.Is There Some Revenue Growth Forecasted For Hospital Corporation of China?
There's an inherent assumption that a company should be matching the industry for P/S ratios like Hospital Corporation of China's to be considered reasonable.
If we review the last year of revenue growth, the company posted a terrific increase of 120%. Pleasingly, revenue has also lifted 178% in aggregate from three years ago, thanks to the last 12 months of growth. Accordingly, shareholders would have definitely welcomed those medium-term rates of revenue growth.
When compared to the industry's one-year growth forecast of 24%, the most recent medium-term revenue trajectory is noticeably more alluring
In light of this, it's curious that Hospital Corporation of China's P/S sits in line with the majority of other companies. Apparently some shareholders believe the recent performance is at its limits and have been accepting lower selling prices.
What We Can Learn From Hospital Corporation of China's P/S?
Hospital Corporation of China appears to be back in favour with a solid price jump bringing its P/S back in line with other companies in the industry Generally, our preference is to limit the use of the price-to-sales ratio to establishing what the market thinks about the overall health of a company.
To our surprise, Hospital Corporation of China revealed its three-year revenue trends aren't contributing to its P/S as much as we would have predicted, given they look better than current industry expectations. When we see strong revenue with faster-than-industry growth, we can only assume potential risks are what might be placing pressure on the P/S ratio. While recent revenue trends over the past medium-term suggest that the risk of a price decline is low, investors appear to see the likelihood of revenue fluctuations in the future.
There are also other vital risk factors to consider and we've discovered 2 warning signs for Hospital Corporation of China (1 is significant!) that you should be aware of before investing here.
If companies with solid past earnings growth is up your alley, you may wish to see this free collection of other companies with strong earnings growth and low P/E ratios.
Valuation is complex, but we're here to simplify it.
Discover if Hospital Corporation of China might be undervalued or overvalued with our detailed analysis, featuring fair value estimates, potential risks, dividends, insider trades, and its financial condition.
Access Free AnalysisHave feedback on this article? Concerned about the content? Get in touch with us directly. Alternatively, email editorial-team (at) simplywallst.com.
This article by Simply Wall St is general in nature. We provide commentary based on historical data and analyst forecasts only using an unbiased methodology and our articles are not intended to be financial advice. It does not constitute a recommendation to buy or sell any stock, and does not take account of your objectives, or your financial situation. We aim to bring you long-term focused analysis driven by fundamental data. Note that our analysis may not factor in the latest price-sensitive company announcements or qualitative material. Simply Wall St has no position in any stocks mentioned.
About SEHK:3869
Hospital Corporation of China
An investment holding company, operates and manages hospitals in the People’s Republic of China.
Good value with worrying balance sheet.
Market Insights

Advertisement
Community Narratives
SSAB in pole position when it comes to the combination of steel tariffs and the EU's investment drive
Fair Value SEK 86.87|35.6% undervalued
PI
Community Contributor
The Future of Lennar and Homebuilding Faces Short Term Challenges with Potential for Long Term Growth
Fair Value US$162.49|35.2% undervalued
ZE
Community Contributor
Saudi Aramco (SASE:2222): Not The Sexiest High Dividend Yield Stock, But One With Interesting 'Convertible-Like' Qualities
Fair Value ر.س37.02|30.0% undervalued
EV
Community Contributor