- Hong Kong
- /
- Healthcare Services
- /
- SEHK:3689
Capital Allocation Trends At Guangdong Kanghua Healthcare (HKG:3689) Aren't Ideal


If we want to find a stock that could multiply over the long term, what are the underlying trends we should look for? In a perfect world, we'd like to see a company investing more capital into its business and ideally the returns earned from that capital are also increasing. Basically this means that a company has profitable initiatives that it can continue to reinvest in, which is a trait of a compounding machine. In light of that, when we looked at Guangdong Kanghua Healthcare (HKG:3689) and its ROCE trend, we weren't exactly thrilled.
What is Return On Capital Employed (ROCE)?
Just to clarify if you're unsure, ROCE is a metric for evaluating how much pre-tax income (in percentage terms) a company earns on the capital invested in its business. To calculate this metric for Guangdong Kanghua Healthcare, this is the formula:
Return on Capital Employed = Earnings Before Interest and Tax (EBIT) ÷ (Total Assets - Current Liabilities)
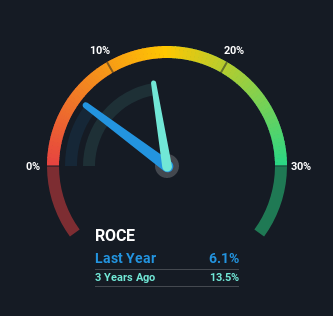
0.061 = CN¥115m ÷ (CN¥2.6b - CN¥758m) (Based on the trailing twelve months to June 2021).
Therefore, Guangdong Kanghua Healthcare has an ROCE of 6.1%. Ultimately, that's a low return and it under-performs the Healthcare industry average of 8.3%.
Check out our latest analysis for Guangdong Kanghua Healthcare
While the past is not representative of the future, it can be helpful to know how a company has performed historically, which is why we have this chart above. If you're interested in investigating Guangdong Kanghua Healthcare's past further, check out this free graph of past earnings, revenue and cash flow.
The Trend Of ROCE
When we looked at the ROCE trend at Guangdong Kanghua Healthcare, we didn't gain much confidence. Around five years ago the returns on capital were 24%, but since then they've fallen to 6.1%. However it looks like Guangdong Kanghua Healthcare might be reinvesting for long term growth because while capital employed has increased, the company's sales haven't changed much in the last 12 months. It may take some time before the company starts to see any change in earnings from these investments.
On a side note, Guangdong Kanghua Healthcare has done well to pay down its current liabilities to 29% of total assets. That could partly explain why the ROCE has dropped. What's more, this can reduce some aspects of risk to the business because now the company's suppliers or short-term creditors are funding less of its operations. Some would claim this reduces the business' efficiency at generating ROCE since it is now funding more of the operations with its own money.
What We Can Learn From Guangdong Kanghua Healthcare's ROCE
Bringing it all together, while we're somewhat encouraged by Guangdong Kanghua Healthcare's reinvestment in its own business, we're aware that returns are shrinking. Moreover, since the stock has crumbled 71% over the last three years, it appears investors are expecting the worst. In any case, the stock doesn't have these traits of a multi-bagger discussed above, so if that's what you're looking for, we think you'd have more luck elsewhere.
If you'd like to know more about Guangdong Kanghua Healthcare, we've spotted 2 warning signs, and 1 of them is significant.
While Guangdong Kanghua Healthcare isn't earning the highest return, check out this free list of companies that are earning high returns on equity with solid balance sheets.
If you're looking for stocks to buy, use the lowest-cost* platform that is rated #1 Overall by Barron’s, Interactive Brokers. Trade stocks, options, futures, forex, bonds and funds on 135 markets, all from a single integrated account. Promoted
If you're looking to trade Guangdong Kanghua Healthcare Group, open an account with the lowest-cost platform trusted by professionals, Interactive Brokers.
With clients in over 200 countries and territories, and access to 160 markets, IBKR lets you trade stocks, options, futures, forex, bonds and funds from a single integrated account.
Enjoy no hidden fees, no account minimums, and FX conversion rates as low as 0.03%, far better than what most brokers offer.
Sponsored ContentNew: Manage All Your Stock Portfolios in One Place
We've created the ultimate portfolio companion for stock investors, and it's free.
• Connect an unlimited number of Portfolios and see your total in one currency
• Be alerted to new Warning Signs or Risks via email or mobile
• Track the Fair Value of your stocks
This article by Simply Wall St is general in nature. We provide commentary based on historical data and analyst forecasts only using an unbiased methodology and our articles are not intended to be financial advice. It does not constitute a recommendation to buy or sell any stock, and does not take account of your objectives, or your financial situation. We aim to bring you long-term focused analysis driven by fundamental data. Note that our analysis may not factor in the latest price-sensitive company announcements or qualitative material. Simply Wall St has no position in any stocks mentioned.
*Interactive Brokers Rated Lowest Cost Broker by StockBrokers.com Annual Online Review 2020
Have feedback on this article? Concerned about the content? Get in touch with us directly. Alternatively, email editorial-team (at) simplywallst.com.
About SEHK:3689
Guangdong Kanghua Healthcare Group
An investment holding company, primarily operates private hospitals in the People’s Republic of China.
Flawless balance sheet second-rate dividend payer.
Market Insights

Community Narratives

