- Hong Kong
- /
- Medical Equipment
- /
- SEHK:2500
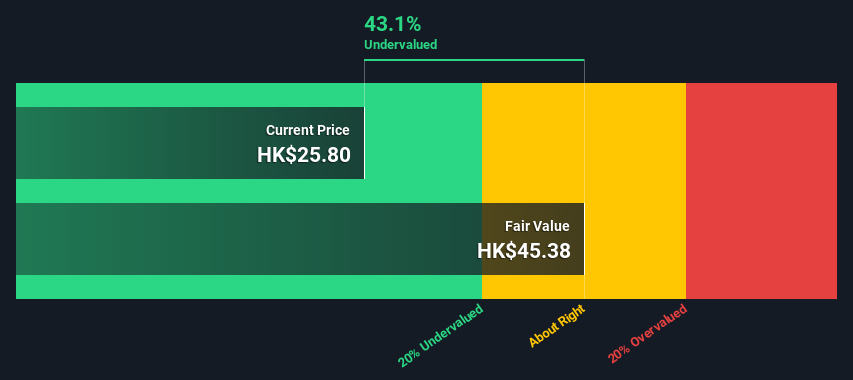
Are Investors Undervaluing Venus Medtech (Hangzhou) Inc. (HKG:2500) By 43%?


In this article we are going to estimate the intrinsic value of Venus Medtech (Hangzhou) Inc. (HKG:2500) by taking the forecast future cash flows of the company and discounting them back to today's value. The Discounted Cash Flow (DCF) model is the tool we will apply to do this. Believe it or not, it's not too difficult to follow, as you'll see from our example!
Companies can be valued in a lot of ways, so we would point out that a DCF is not perfect for every situation. Anyone interested in learning a bit more about intrinsic value should have a read of the Simply Wall St analysis model.
View our latest analysis for Venus Medtech (Hangzhou)
The calculation
We're using the 2-stage growth model, which simply means we take in account two stages of company's growth. In the initial period the company may have a higher growth rate and the second stage is usually assumed to have a stable growth rate. To begin with, we have to get estimates of the next ten years of cash flows. Where possible we use analyst estimates, but when these aren't available we extrapolate the previous free cash flow (FCF) from the last estimate or reported value. We assume companies with shrinking free cash flow will slow their rate of shrinkage, and that companies with growing free cash flow will see their growth rate slow, over this period. We do this to reflect that growth tends to slow more in the early years than it does in later years.
A DCF is all about the idea that a dollar in the future is less valuable than a dollar today, and so the sum of these future cash flows is then discounted to today's value:
10-year free cash flow (FCF) estimate
| 2022 | 2023 | 2024 | 2025 | 2026 | 2027 | 2028 | 2029 | 2030 | 2031 | |
| Levered FCF (CN¥, Millions) | -CN¥178.0m | -CN¥53.3m | CN¥66.5m | CN¥390.5m | CN¥549.0m | CN¥670.8m | CN¥778.0m | CN¥868.4m | CN¥942.9m | CN¥1.00b |
| Growth Rate Estimate Source | Analyst x3 | Analyst x3 | Analyst x2 | Analyst x2 | Analyst x2 | Est @ 22.19% | Est @ 15.97% | Est @ 11.63% | Est @ 8.58% | Est @ 6.45% |
| Present Value (CN¥, Millions) Discounted @ 5.9% | -CN¥168 | -CN¥47.6 | CN¥56.0 | CN¥311 | CN¥412 | CN¥476 | CN¥521 | CN¥549 | CN¥563 | CN¥566 |
("Est" = FCF growth rate estimated by Simply Wall St)
Present Value of 10-year Cash Flow (PVCF) = CN¥3.2b
The second stage is also known as Terminal Value, this is the business's cash flow after the first stage. For a number of reasons a very conservative growth rate is used that cannot exceed that of a country's GDP growth. In this case we have used the 5-year average of the 10-year government bond yield (1.5%) to estimate future growth. In the same way as with the 10-year 'growth' period, we discount future cash flows to today's value, using a cost of equity of 5.9%.
Terminal Value (TV)= FCF2031 × (1 + g) ÷ (r – g) = CN¥1.0b× (1 + 1.5%) ÷ (5.9%– 1.5%) = CN¥23b
Present Value of Terminal Value (PVTV)= TV / (1 + r)10= CN¥23b÷ ( 1 + 5.9%)10= CN¥13b
The total value is the sum of cash flows for the next ten years plus the discounted terminal value, which results in the Total Equity Value, which in this case is CN¥16b. The last step is to then divide the equity value by the number of shares outstanding. Relative to the current share price of HK$25.8, the company appears quite undervalued at a 43% discount to where the stock price trades currently. Valuations are imprecise instruments though, rather like a telescope - move a few degrees and end up in a different galaxy. Do keep this in mind.
Important assumptions
We would point out that the most important inputs to a discounted cash flow are the discount rate and of course the actual cash flows. You don't have to agree with these inputs, I recommend redoing the calculations yourself and playing with them. The DCF also does not consider the possible cyclicality of an industry, or a company's future capital requirements, so it does not give a full picture of a company's potential performance. Given that we are looking at Venus Medtech (Hangzhou) as potential shareholders, the cost of equity is used as the discount rate, rather than the cost of capital (or weighted average cost of capital, WACC) which accounts for debt. In this calculation we've used 5.9%, which is based on a levered beta of 0.888. Beta is a measure of a stock's volatility, compared to the market as a whole. We get our beta from the industry average beta of globally comparable companies, with an imposed limit between 0.8 and 2.0, which is a reasonable range for a stable business.
Looking Ahead:
Although the valuation of a company is important, it shouldn't be the only metric you look at when researching a company. DCF models are not the be-all and end-all of investment valuation. Preferably you'd apply different cases and assumptions and see how they would impact the company's valuation. For instance, if the terminal value growth rate is adjusted slightly, it can dramatically alter the overall result. Why is the intrinsic value higher than the current share price? For Venus Medtech (Hangzhou), we've put together three important aspects you should further research:
- Risks: Consider for instance, the ever-present spectre of investment risk. We've identified 2 warning signs with Venus Medtech (Hangzhou) , and understanding these should be part of your investment process.
- Future Earnings: How does 2500's growth rate compare to its peers and the wider market? Dig deeper into the analyst consensus number for the upcoming years by interacting with our free analyst growth expectation chart.
- Other Solid Businesses: Low debt, high returns on equity and good past performance are fundamental to a strong business. Why not explore our interactive list of stocks with solid business fundamentals to see if there are other companies you may not have considered!
PS. Simply Wall St updates its DCF calculation for every Hong Kong stock every day, so if you want to find the intrinsic value of any other stock just search here.
New: Manage All Your Stock Portfolios in One Place
We've created the ultimate portfolio companion for stock investors, and it's free.
• Connect an unlimited number of Portfolios and see your total in one currency
• Be alerted to new Warning Signs or Risks via email or mobile
• Track the Fair Value of your stocks
Have feedback on this article? Concerned about the content? Get in touch with us directly. Alternatively, email editorial-team (at) simplywallst.com.
This article by Simply Wall St is general in nature. We provide commentary based on historical data and analyst forecasts only using an unbiased methodology and our articles are not intended to be financial advice. It does not constitute a recommendation to buy or sell any stock, and does not take account of your objectives, or your financial situation. We aim to bring you long-term focused analysis driven by fundamental data. Note that our analysis may not factor in the latest price-sensitive company announcements or qualitative material. Simply Wall St has no position in any stocks mentioned.
About SEHK:2500
Venus Medtech (Hangzhou)
Engages in the research, development, clinical development, manufacturing, and sale of bioprosthetic heart valves in Mainland China and internationally.
Adequate balance sheet low.

