Shandong Fengxiang Co., Ltd's (HKG:9977) Stock's On An Uptrend: Are Strong Financials Guiding The Market?


Shandong Fengxiang (HKG:9977) has had a great run on the share market with its stock up by a significant 36% over the last month. Since the market usually pay for a company’s long-term fundamentals, we decided to study the company’s key performance indicators to see if they could be influencing the market. Particularly, we will be paying attention to Shandong Fengxiang's ROE today.
ROE or return on equity is a useful tool to assess how effectively a company can generate returns on the investment it received from its shareholders. Put another way, it reveals the company's success at turning shareholder investments into profits.
View our latest analysis for Shandong Fengxiang
How To Calculate Return On Equity?
The formula for return on equity is:
Return on Equity = Net Profit (from continuing operations) ÷ Shareholders' Equity
So, based on the above formula, the ROE for Shandong Fengxiang is:
27% = CN¥641m ÷ CN¥2.4b (Based on the trailing twelve months to June 2020).
The 'return' is the yearly profit. That means that for every HK$1 worth of shareholders' equity, the company generated HK$0.27 in profit.
What Has ROE Got To Do With Earnings Growth?
Thus far, we have learned that ROE measures how efficiently a company is generating its profits. Depending on how much of these profits the company reinvests or "retains", and how effectively it does so, we are then able to assess a company’s earnings growth potential. Assuming everything else remains unchanged, the higher the ROE and profit retention, the higher the growth rate of a company compared to companies that don't necessarily bear these characteristics.
Shandong Fengxiang's Earnings Growth And 27% ROE
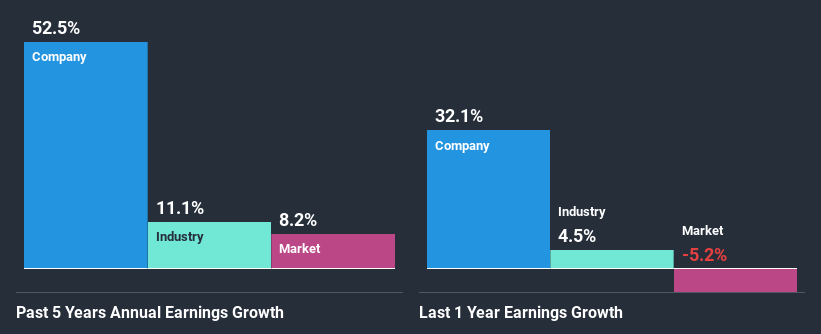
To begin with, Shandong Fengxiang has a pretty high ROE which is interesting. Second, a comparison with the average ROE reported by the industry of 11% also doesn't go unnoticed by us. As a result, Shandong Fengxiang's exceptional 52% net income growth seen over the past five years, doesn't come as a surprise.
We then compared Shandong Fengxiang's net income growth with the industry and we're pleased to see that the company's growth figure is higher when compared with the industry which has a growth rate of 11% in the same period.
Earnings growth is an important metric to consider when valuing a stock. It’s important for an investor to know whether the market has priced in the company's expected earnings growth (or decline). This then helps them determine if the stock is placed for a bright or bleak future. One good indicator of expected earnings growth is the P/E ratio which determines the price the market is willing to pay for a stock based on its earnings prospects. So, you may want to check if Shandong Fengxiang is trading on a high P/E or a low P/E, relative to its industry.
Is Shandong Fengxiang Making Efficient Use Of Its Profits?
Conclusion
In total, we are pretty happy with Shandong Fengxiang's performance. Particularly, we like that the company is reinvesting heavily into its business, and at a high rate of return. Unsurprisingly, this has led to an impressive earnings growth. Having said that, the company's earnings growth is expected to slow down, as forecasted in the current analyst estimates. Are these analysts expectations based on the broad expectations for the industry, or on the company's fundamentals? Click here to be taken to our analyst's forecasts page for the company.
When trading Shandong Fengxiang or any other investment, use the platform considered by many to be the Professional's Gateway to the Worlds Market, Interactive Brokers. You get the lowest-cost* trading on stocks, options, futures, forex, bonds and funds worldwide from a single integrated account. Promoted
New: Manage All Your Stock Portfolios in One Place
We've created the ultimate portfolio companion for stock investors, and it's free.
• Connect an unlimited number of Portfolios and see your total in one currency
• Be alerted to new Warning Signs or Risks via email or mobile
• Track the Fair Value of your stocks
This article by Simply Wall St is general in nature. It does not constitute a recommendation to buy or sell any stock, and does not take account of your objectives, or your financial situation. We aim to bring you long-term focused analysis driven by fundamental data. Note that our analysis may not factor in the latest price-sensitive company announcements or qualitative material. Simply Wall St has no position in any stocks mentioned.
*Interactive Brokers Rated Lowest Cost Broker by StockBrokers.com Annual Online Review 2020
Have feedback on this article? Concerned about the content? Get in touch with us directly. Alternatively, email editorial-team@simplywallst.com.
About SEHK:9977
Shandong Fengxiang
Engages in the research and development, processing, and sale of chicken meat products from white-feathered broilers in the People’s Republic of China.
Flawless balance sheet low.
Market Insights

Community Narratives
