We Think ZJLD Group (HKG:6979) Can Stay On Top Of Its Debt


Howard Marks put it nicely when he said that, rather than worrying about share price volatility, 'The possibility of permanent loss is the risk I worry about... and every practical investor I know worries about.' So it seems the smart money knows that debt - which is usually involved in bankruptcies - is a very important factor, when you assess how risky a company is. As with many other companies ZJLD Group Inc (HKG:6979) makes use of debt. But the real question is whether this debt is making the company risky.
Why Does Debt Bring Risk?
Debt and other liabilities become risky for a business when it cannot easily fulfill those obligations, either with free cash flow or by raising capital at an attractive price. If things get really bad, the lenders can take control of the business. While that is not too common, we often do see indebted companies permanently diluting shareholders because lenders force them to raise capital at a distressed price. Of course, plenty of companies use debt to fund growth, without any negative consequences. The first thing to do when considering how much debt a business uses is to look at its cash and debt together.
View our latest analysis for ZJLD Group
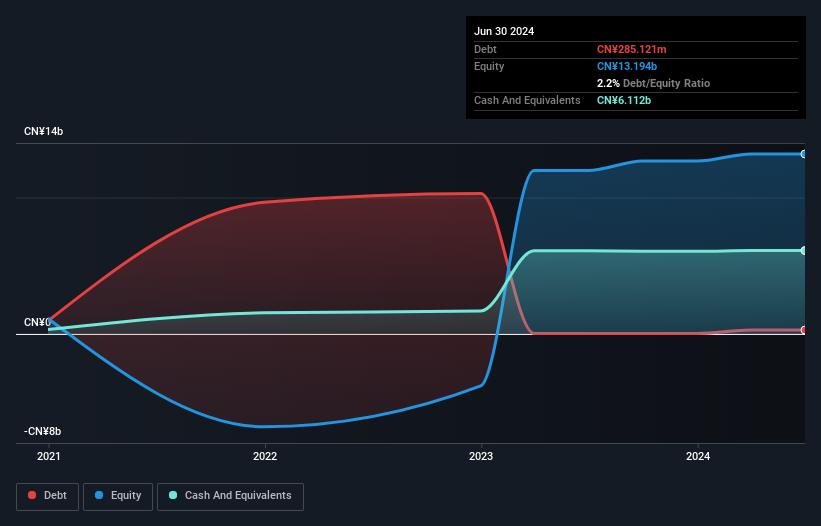
What Is ZJLD Group's Debt?
As you can see below, at the end of June 2024, ZJLD Group had CN¥285.1m of debt, up from CN¥36.6m a year ago. Click the image for more detail. However, it does have CN¥6.11b in cash offsetting this, leading to net cash of CN¥5.83b.
A Look At ZJLD Group's Liabilities
According to the last reported balance sheet, ZJLD Group had liabilities of CN¥4.82b due within 12 months, and liabilities of CN¥42.8m due beyond 12 months. Offsetting these obligations, it had cash of CN¥6.11b as well as receivables valued at CN¥331.6m due within 12 months. So it can boast CN¥1.58b more liquid assets than total liabilities.
This short term liquidity is a sign that ZJLD Group could probably pay off its debt with ease, as its balance sheet is far from stretched. Simply put, the fact that ZJLD Group has more cash than debt is arguably a good indication that it can manage its debt safely.
And we also note warmly that ZJLD Group grew its EBIT by 13% last year, making its debt load easier to handle. The balance sheet is clearly the area to focus on when you are analysing debt. But it is future earnings, more than anything, that will determine ZJLD Group's ability to maintain a healthy balance sheet going forward. So if you want to see what the professionals think, you might find this free report on analyst profit forecasts to be interesting.
But our final consideration is also important, because a company cannot pay debt with paper profits; it needs cold hard cash. ZJLD Group may have net cash on the balance sheet, but it is still interesting to look at how well the business converts its earnings before interest and tax (EBIT) to free cash flow, because that will influence both its need for, and its capacity to manage debt. Over the last three years, ZJLD Group saw substantial negative free cash flow, in total. While that may be a result of expenditure for growth, it does make the debt far more risky.
Summing Up
While it is always sensible to investigate a company's debt, in this case ZJLD Group has CN¥5.83b in net cash and a decent-looking balance sheet. And it also grew its EBIT by 13% over the last year. So we don't have any problem with ZJLD Group's use of debt. When analysing debt levels, the balance sheet is the obvious place to start. But ultimately, every company can contain risks that exist outside of the balance sheet. For example ZJLD Group has 3 warning signs (and 1 which is potentially serious) we think you should know about.
Of course, if you're the type of investor who prefers buying stocks without the burden of debt, then don't hesitate to discover our exclusive list of net cash growth stocks, today.
If you're looking to trade ZJLD Group, open an account with the lowest-cost platform trusted by professionals, Interactive Brokers.
With clients in over 200 countries and territories, and access to 160 markets, IBKR lets you trade stocks, options, futures, forex, bonds and funds from a single integrated account.
Enjoy no hidden fees, no account minimums, and FX conversion rates as low as 0.03%, far better than what most brokers offer.
Sponsored ContentValuation is complex, but we're here to simplify it.
Discover if ZJLD Group might be undervalued or overvalued with our detailed analysis, featuring fair value estimates, potential risks, dividends, insider trades, and its financial condition.
Access Free AnalysisHave feedback on this article? Concerned about the content? Get in touch with us directly. Alternatively, email editorial-team (at) simplywallst.com.
This article by Simply Wall St is general in nature. We provide commentary based on historical data and analyst forecasts only using an unbiased methodology and our articles are not intended to be financial advice. It does not constitute a recommendation to buy or sell any stock, and does not take account of your objectives, or your financial situation. We aim to bring you long-term focused analysis driven by fundamental data. Note that our analysis may not factor in the latest price-sensitive company announcements or qualitative material. Simply Wall St has no position in any stocks mentioned.
About SEHK:6979
ZJLD Group
Engages in the production and sale of baijiu products in China.
Excellent balance sheet and good value.

