Star Plus Legend Holdings Limited (HKG:6683) Stock's Been Sliding But Fundamentals Look Decent: Will The Market Correct The Share Price In The Future?


Star Plus Legend Holdings (HKG:6683) has had a rough month with its share price down 10%. However, the company's fundamentals look pretty decent, and long-term financials are usually aligned with future market price movements. Specifically, we decided to study Star Plus Legend Holdings' ROE in this article.
Return on equity or ROE is an important factor to be considered by a shareholder because it tells them how effectively their capital is being reinvested. In short, ROE shows the profit each dollar generates with respect to its shareholder investments.
Check out our latest analysis for Star Plus Legend Holdings
How Is ROE Calculated?
Return on equity can be calculated by using the formula:
Return on Equity = Net Profit (from continuing operations) ÷ Shareholders' Equity
So, based on the above formula, the ROE for Star Plus Legend Holdings is:
6.0% = CN¥41m ÷ CN¥692m (Based on the trailing twelve months to December 2023).
The 'return' is the yearly profit. So, this means that for every HK$1 of its shareholder's investments, the company generates a profit of HK$0.06.
Why Is ROE Important For Earnings Growth?
So far, we've learned that ROE is a measure of a company's profitability. We now need to evaluate how much profit the company reinvests or "retains" for future growth which then gives us an idea about the growth potential of the company. Generally speaking, other things being equal, firms with a high return on equity and profit retention, have a higher growth rate than firms that don’t share these attributes.
Star Plus Legend Holdings' Earnings Growth And 6.0% ROE
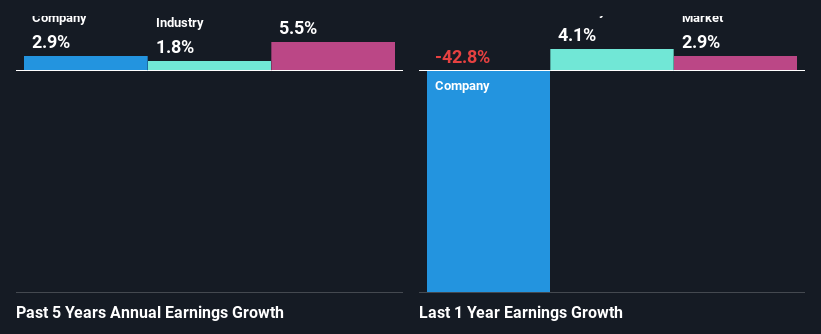
At first glance, Star Plus Legend Holdings' ROE doesn't look very promising. A quick further study shows that the company's ROE doesn't compare favorably to the industry average of 8.3% either. Accordingly, Star Plus Legend Holdings' low net income growth of 2.9% over the past five years can possibly be explained by the low ROE amongst other factors.
We then compared Star Plus Legend Holdings' net income growth with the industry and we're pleased to see that the company's growth figure is higher when compared with the industry which has a growth rate of 1.8% in the same 5-year period.
Earnings growth is a huge factor in stock valuation. What investors need to determine next is if the expected earnings growth, or the lack of it, is already built into the share price. This then helps them determine if the stock is placed for a bright or bleak future. If you're wondering about Star Plus Legend Holdings''s valuation, check out this gauge of its price-to-earnings ratio, as compared to its industry.
Is Star Plus Legend Holdings Making Efficient Use Of Its Profits?
Star Plus Legend Holdings doesn't pay any regular dividends, meaning that potentially all of its profits are being reinvested in the business. However, this doesn't explain the low earnings growth the company has seen. So there might be other factors at play here which could potentially be hampering growth. For example, the business has faced some headwinds.
Conclusion
In total, it does look like Star Plus Legend Holdings has some positive aspects to its business. With a high rate of reinvestment, albeit at a low ROE, the company has managed to see a considerable growth in its earnings. With that said, the latest industry analyst forecasts reveal that the company's earnings are expected to accelerate. To know more about the company's future earnings growth forecasts take a look at this free report on analyst forecasts for the company to find out more.
New: Manage All Your Stock Portfolios in One Place
We've created the ultimate portfolio companion for stock investors, and it's free.
• Connect an unlimited number of Portfolios and see your total in one currency
• Be alerted to new Warning Signs or Risks via email or mobile
• Track the Fair Value of your stocks
Have feedback on this article? Concerned about the content? Get in touch with us directly. Alternatively, email editorial-team (at) simplywallst.com.
This article by Simply Wall St is general in nature. We provide commentary based on historical data and analyst forecasts only using an unbiased methodology and our articles are not intended to be financial advice. It does not constitute a recommendation to buy or sell any stock, and does not take account of your objectives, or your financial situation. We aim to bring you long-term focused analysis driven by fundamental data. Note that our analysis may not factor in the latest price-sensitive company announcements or qualitative material. Simply Wall St has no position in any stocks mentioned.
Have feedback on this article? Concerned about the content? Get in touch with us directly. Alternatively, email editorial-team@simplywallst.com
About SEHK:6683
Star Plus Legend Holdings
An investment holding company, engages in retail and IP creation and operation business in the People's Republic of China.
Reasonable growth potential with adequate balance sheet.
