- Hong Kong
- /
- Oil and Gas
- /
- SEHK:9689
JTF International Holdings Limited's (HKG:9689) Shares Leap 30% Yet They're Still Not Telling The Full Story

JTF International Holdings Limited (HKG:9689) shareholders have had their patience rewarded with a 30% share price jump in the last month. Looking further back, the 16% rise over the last twelve months isn't too bad notwithstanding the strength over the last 30 days.
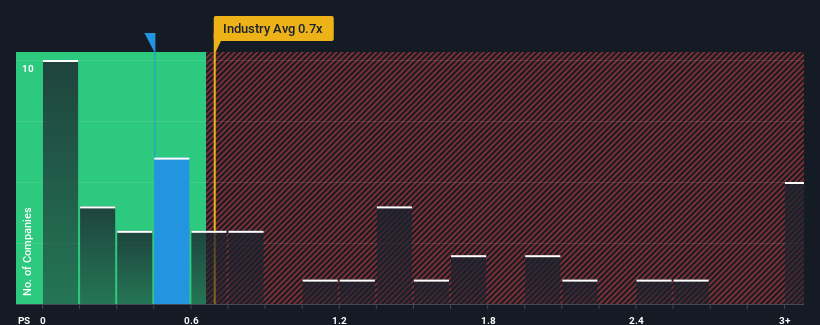
Although its price has surged higher, you could still be forgiven for feeling indifferent about JTF International Holdings' P/S ratio of 0.5x, since the median price-to-sales (or "P/S") ratio for the Oil and Gas industry in Hong Kong is also close to 0.7x. Although, it's not wise to simply ignore the P/S without explanation as investors may be disregarding a distinct opportunity or a costly mistake.
View our latest analysis for JTF International Holdings
What Does JTF International Holdings' P/S Mean For Shareholders?
As an illustration, revenue has deteriorated at JTF International Holdings over the last year, which is not ideal at all. Perhaps investors believe the recent revenue performance is enough to keep in line with the industry, which is keeping the P/S from dropping off. If you like the company, you'd at least be hoping this is the case so that you could potentially pick up some stock while it's not quite in favour.
Want the full picture on earnings, revenue and cash flow for the company? Then our free report on JTF International Holdings will help you shine a light on its historical performance.Do Revenue Forecasts Match The P/S Ratio?
JTF International Holdings' P/S ratio would be typical for a company that's only expected to deliver moderate growth, and importantly, perform in line with the industry.
Retrospectively, the last year delivered a frustrating 19% decrease to the company's top line. Regardless, revenue has managed to lift by a handy 13% in aggregate from three years ago, thanks to the earlier period of growth. Accordingly, while they would have preferred to keep the run going, shareholders would be roughly satisfied with the medium-term rates of revenue growth.
Comparing that to the industry, which is only predicted to deliver 1.8% growth in the next 12 months, the company's momentum is stronger based on recent medium-term annualised revenue results.
In light of this, it's curious that JTF International Holdings' P/S sits in line with the majority of other companies. Apparently some shareholders believe the recent performance is at its limits and have been accepting lower selling prices.
What Does JTF International Holdings' P/S Mean For Investors?
Its shares have lifted substantially and now JTF International Holdings' P/S is back within range of the industry median. Using the price-to-sales ratio alone to determine if you should sell your stock isn't sensible, however it can be a practical guide to the company's future prospects.
We didn't quite envision JTF International Holdings' P/S sitting in line with the wider industry, considering the revenue growth over the last three-year is higher than the current industry outlook. When we see strong revenue with faster-than-industry growth, we can only assume potential risks are what might be placing pressure on the P/S ratio. At least the risk of a price drop looks to be subdued if recent medium-term revenue trends continue, but investors seem to think future revenue could see some volatility.
You should always think about risks. Case in point, we've spotted 3 warning signs for JTF International Holdings you should be aware of, and 1 of them doesn't sit too well with us.
If strong companies turning a profit tickle your fancy, then you'll want to check out this free list of interesting companies that trade on a low P/E (but have proven they can grow earnings).
New: Manage All Your Stock Portfolios in One Place
We've created the ultimate portfolio companion for stock investors, and it's free.
• Connect an unlimited number of Portfolios and see your total in one currency
• Be alerted to new Warning Signs or Risks via email or mobile
• Track the Fair Value of your stocks
Have feedback on this article? Concerned about the content? Get in touch with us directly. Alternatively, email editorial-team (at) simplywallst.com.
This article by Simply Wall St is general in nature. We provide commentary based on historical data and analyst forecasts only using an unbiased methodology and our articles are not intended to be financial advice. It does not constitute a recommendation to buy or sell any stock, and does not take account of your objectives, or your financial situation. We aim to bring you long-term focused analysis driven by fundamental data. Note that our analysis may not factor in the latest price-sensitive company announcements or qualitative material. Simply Wall St has no position in any stocks mentioned.
About SEHK:9689
JTF International Holdings
An investment holding company, engages in the blending and selling of fuel oil in the People’s Republic of China.
Flawless balance sheet low.

