
Advertisement
- Hong Kong
- /
- Oil and Gas
- /
- SEHK:8347
Be Wary Of F8 Enterprises (Holdings) Group (HKG:8347) And Its Returns On Capital
To avoid investing in a business that's in decline, there's a few financial metrics that can provide early indications of aging. When we see a declining return on capital employed (ROCE) in conjunction with a declining base of capital employed, that's often how a mature business shows signs of aging. This combination can tell you that not only is the company investing less, it's earning less on what it does invest. Having said that, after a brief look, F8 Enterprises (Holdings) Group (HKG:8347) we aren't filled with optimism, but let's investigate further.
Understanding Return On Capital Employed (ROCE)
Just to clarify if you're unsure, ROCE is a metric for evaluating how much pre-tax income (in percentage terms) a company earns on the capital invested in its business. Analysts use this formula to calculate it for F8 Enterprises (Holdings) Group:
Return on Capital Employed = Earnings Before Interest and Tax (EBIT) ÷ (Total Assets - Current Liabilities)
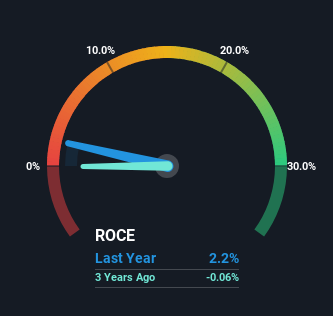
0.022 = HK$2.1m ÷ (HK$162m - HK$67m) (Based on the trailing twelve months to September 2024).
Therefore, F8 Enterprises (Holdings) Group has an ROCE of 2.2%. Ultimately, that's a low return and it under-performs the Oil and Gas industry average of 6.9%.
View our latest analysis for F8 Enterprises (Holdings) Group
While the past is not representative of the future, it can be helpful to know how a company has performed historically, which is why we have this chart above. If you'd like to look at how F8 Enterprises (Holdings) Group has performed in the past in other metrics, you can view this free graph of F8 Enterprises (Holdings) Group's past earnings, revenue and cash flow.
What Does the ROCE Trend For F8 Enterprises (Holdings) Group Tell Us?
In terms of F8 Enterprises (Holdings) Group's historical ROCE trend, it isn't fantastic. The company used to generate 6.0% on its capital five years ago but it has since fallen noticeably. In addition to that, F8 Enterprises (Holdings) Group is now employing 22% less capital than it was five years ago. The combination of lower ROCE and less capital employed can indicate that a business is likely to be facing some competitive headwinds or seeing an erosion to its moat. If these underlying trends continue, we wouldn't be too optimistic going forward.
While on the subject, we noticed that the ratio of current liabilities to total assets has risen to 42%, which has impacted the ROCE. Without this increase, it's likely that ROCE would be even lower than 2.2%. And with current liabilities at these levels, suppliers or short-term creditors are effectively funding a large part of the business, which can introduce some risks.
Our Take On F8 Enterprises (Holdings) Group's ROCE
In short, lower returns and decreasing amounts capital employed in the business doesn't fill us with confidence. We expect this has contributed to the stock plummeting 95% during the last five years. Unless there is a shift to a more positive trajectory in these metrics, we would look elsewhere.
If you want to know some of the risks facing F8 Enterprises (Holdings) Group we've found 3 warning signs (2 are a bit concerning!) that you should be aware of before investing here.
While F8 Enterprises (Holdings) Group may not currently earn the highest returns, we've compiled a list of companies that currently earn more than 25% return on equity. Check out this free list here.
New: AI Stock Screener & Alerts
Our new AI Stock Screener scans the market every day to uncover opportunities.
• Dividend Powerhouses (3%+ Yield)
• Undervalued Small Caps with Insider Buying
• High growth Tech and AI Companies
Or build your own from over 50 metrics.
Have feedback on this article? Concerned about the content? Get in touch with us directly. Alternatively, email editorial-team (at) simplywallst.com.
This article by Simply Wall St is general in nature. We provide commentary based on historical data and analyst forecasts only using an unbiased methodology and our articles are not intended to be financial advice. It does not constitute a recommendation to buy or sell any stock, and does not take account of your objectives, or your financial situation. We aim to bring you long-term focused analysis driven by fundamental data. Note that our analysis may not factor in the latest price-sensitive company announcements or qualitative material. Simply Wall St has no position in any stocks mentioned.
About SEHK:8347
F8 Enterprises (Holdings) Group
An investment holding company, engages in the sale and transportation of diesel oil and related products in Hong Kong.
Flawless balance sheet and good value.
Market Insights

Advertisement
Community Narratives
MINISO's fair value is projected at 26.69 with an anticipated PE ratio shift of 20x
Fair Value US$24.03|11.0% undervalued
BE
Community Contributor
Procter & Gamble: A Dividend Giant Facing Slowing Growth
Fair Value US$119.81|23.3% overvalued
AN
Community Contributor
Eli Lilly's Future Growth Driven by Tirzepatide and Favorable Market Conditions
Fair Value US$1.19k|13.8% undervalued
EA
Community Contributor