- Hong Kong
- /
- Oil and Gas
- /
- SEHK:467
It's Down 52% But United Energy Group Limited (HKG:467) Could Be Riskier Than It Looks

The United Energy Group Limited (HKG:467) share price has fared very poorly over the last month, falling by a substantial 52%. For any long-term shareholders, the last month ends a year to forget by locking in a 60% share price decline.
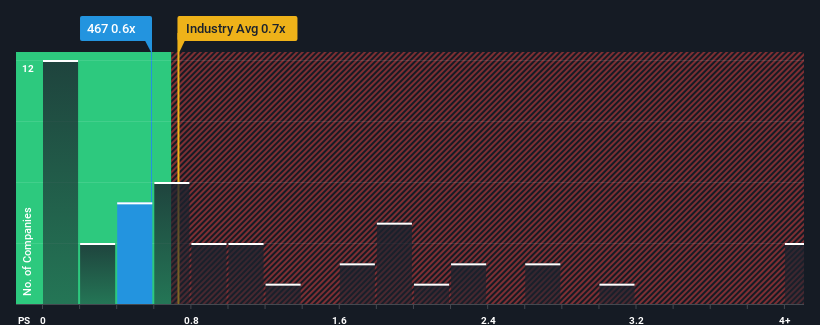
Although its price has dipped substantially, it's still not a stretch to say that United Energy Group's price-to-sales (or "P/S") ratio of 0.6x right now seems quite "middle-of-the-road" compared to the Oil and Gas industry in Hong Kong, where the median P/S ratio is around 0.7x. Although, it's not wise to simply ignore the P/S without explanation as investors may be disregarding a distinct opportunity or a costly mistake.
See our latest analysis for United Energy Group

What Does United Energy Group's Recent Performance Look Like?
Recent times have been pleasing for United Energy Group as its revenue has risen in spite of the industry's average revenue going into reverse. One possibility is that the P/S ratio is moderate because investors think the company's revenue will be less resilient moving forward. If not, then existing shareholders have reason to be feeling optimistic about the future direction of the share price.
If you'd like to see what analysts are forecasting going forward, you should check out our free report on United Energy Group.Do Revenue Forecasts Match The P/S Ratio?
The only time you'd be comfortable seeing a P/S like United Energy Group's is when the company's growth is tracking the industry closely.
Retrospectively, the last year delivered an exceptional 26% gain to the company's top line. The latest three year period has also seen an excellent 119% overall rise in revenue, aided by its short-term performance. Therefore, it's fair to say the revenue growth recently has been superb for the company.
Looking ahead now, revenue is anticipated to climb by 10% per year during the coming three years according to the three analysts following the company. Meanwhile, the rest of the industry is forecast to only expand by 0.4% per annum, which is noticeably less attractive.
With this in consideration, we find it intriguing that United Energy Group's P/S is closely matching its industry peers. It may be that most investors aren't convinced the company can achieve future growth expectations.
What We Can Learn From United Energy Group's P/S?
United Energy Group's plummeting stock price has brought its P/S back to a similar region as the rest of the industry. Typically, we'd caution against reading too much into price-to-sales ratios when settling on investment decisions, though it can reveal plenty about what other market participants think about the company.
We've established that United Energy Group currently trades on a lower than expected P/S since its forecasted revenue growth is higher than the wider industry. Perhaps uncertainty in the revenue forecasts are what's keeping the P/S ratio consistent with the rest of the industry. However, if you agree with the analysts' forecasts, you may be able to pick up the stock at an attractive price.
Before you settle on your opinion, we've discovered 3 warning signs for United Energy Group that you should be aware of.
If strong companies turning a profit tickle your fancy, then you'll want to check out this free list of interesting companies that trade on a low P/E (but have proven they can grow earnings).
New: AI Stock Screener & Alerts
Our new AI Stock Screener scans the market every day to uncover opportunities.
• Dividend Powerhouses (3%+ Yield)
• Undervalued Small Caps with Insider Buying
• High growth Tech and AI Companies
Or build your own from over 50 metrics.
Have feedback on this article? Concerned about the content? Get in touch with us directly. Alternatively, email editorial-team (at) simplywallst.com.
This article by Simply Wall St is general in nature. We provide commentary based on historical data and analyst forecasts only using an unbiased methodology and our articles are not intended to be financial advice. It does not constitute a recommendation to buy or sell any stock, and does not take account of your objectives, or your financial situation. We aim to bring you long-term focused analysis driven by fundamental data. Note that our analysis may not factor in the latest price-sensitive company announcements or qualitative material. Simply Wall St has no position in any stocks mentioned.
Have feedback on this article? Concerned about the content? Get in touch with us directly. Alternatively, email editorial-team@simplywallst.com
About SEHK:467
United Energy Group
An investment holding company, engages in the investment and operation of upstream oil, natural gas, clean energy, and energy trading businesses in South Asia, the Middle East, and North Africa.
Flawless balance sheet and undervalued.
Similar Companies
Market Insights
Community Narratives


