- Hong Kong
- /
- Oil and Gas
- /
- SEHK:1555
The Trend Of High Returns At MIE Holdings (HKG:1555) Has Us Very Interested


What are the early trends we should look for to identify a stock that could multiply in value over the long term? One common approach is to try and find a company with returns on capital employed (ROCE) that are increasing, in conjunction with a growing amount of capital employed. If you see this, it typically means it's a company with a great business model and plenty of profitable reinvestment opportunities. So when we looked at the ROCE trend of MIE Holdings (HKG:1555) we really liked what we saw.
Understanding Return On Capital Employed (ROCE)
Just to clarify if you're unsure, ROCE is a metric for evaluating how much pre-tax income (in percentage terms) a company earns on the capital invested in its business. Analysts use this formula to calculate it for MIE Holdings:
Return on Capital Employed = Earnings Before Interest and Tax (EBIT) ÷ (Total Assets - Current Liabilities)
0.42 = CN¥428m ÷ (CN¥2.3b - CN¥1.3b) (Based on the trailing twelve months to June 2023).
So, MIE Holdings has an ROCE of 42%. In absolute terms that's a great return and it's even better than the Oil and Gas industry average of 6.3%.
Check out our latest analysis for MIE Holdings
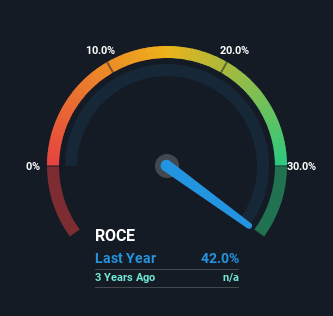
Historical performance is a great place to start when researching a stock so above you can see the gauge for MIE Holdings' ROCE against it's prior returns. If you're interested in investigating MIE Holdings' past further, check out this free graph of past earnings, revenue and cash flow.
The Trend Of ROCE
Like most people, we're pleased that MIE Holdings is now generating some pretax earnings. While the business is profitable now, it used to be incurring losses on invested capital five years ago. Additionally, the business is utilizing 82% less capital than it was five years ago, and taken at face value, that can mean the company needs less funds at work to get a return. The reduction could indicate that the company is selling some assets, and considering returns are up, they appear to be selling the right ones.
For the record though, there was a noticeable increase in the company's current liabilities over the period, so we would attribute some of the ROCE growth to that. The current liabilities has increased to 55% of total assets, so the business is now more funded by the likes of its suppliers or short-term creditors. And with current liabilities at those levels, that's pretty high.
The Bottom Line
In a nutshell, we're pleased to see that MIE Holdings has been able to generate higher returns from less capital. Given the stock has declined 54% in the last five years, this could be a good investment if the valuation and other metrics are also appealing. So researching this company further and determining whether or not these trends will continue seems justified.
MIE Holdings does have some risks, we noticed 3 warning signs (and 2 which are potentially serious) we think you should know about.
If you'd like to see other companies earning high returns, check out our free list of companies earning high returns with solid balance sheets here.
If you're looking to trade MIE Holdings, open an account with the lowest-cost platform trusted by professionals, Interactive Brokers.
With clients in over 200 countries and territories, and access to 160 markets, IBKR lets you trade stocks, options, futures, forex, bonds and funds from a single integrated account.
Enjoy no hidden fees, no account minimums, and FX conversion rates as low as 0.03%, far better than what most brokers offer.
Sponsored ContentNew: Manage All Your Stock Portfolios in One Place
We've created the ultimate portfolio companion for stock investors, and it's free.
• Connect an unlimited number of Portfolios and see your total in one currency
• Be alerted to new Warning Signs or Risks via email or mobile
• Track the Fair Value of your stocks
Have feedback on this article? Concerned about the content? Get in touch with us directly. Alternatively, email editorial-team (at) simplywallst.com.
This article by Simply Wall St is general in nature. We provide commentary based on historical data and analyst forecasts only using an unbiased methodology and our articles are not intended to be financial advice. It does not constitute a recommendation to buy or sell any stock, and does not take account of your objectives, or your financial situation. We aim to bring you long-term focused analysis driven by fundamental data. Note that our analysis may not factor in the latest price-sensitive company announcements or qualitative material. Simply Wall St has no position in any stocks mentioned.
About SEHK:1555
MIE Holdings
Explores, develops, produces, and sells crude oil and other petroleum products under Daan Oilfield production sharing contracts located in northeast China.
Good value low.
Similar Companies
Market Insights

Community Narratives

