- Hong Kong
- /
- Energy Services
- /
- SEHK:1080
Shengli Oil & Gas Pipe Holdings Limited's (HKG:1080) 26% Share Price Surge Not Quite Adding Up


Shengli Oil & Gas Pipe Holdings Limited (HKG:1080) shareholders would be excited to see that the share price has had a great month, posting a 26% gain and recovering from prior weakness. Not all shareholders will be feeling jubilant, since the share price is still down a very disappointing 26% in the last twelve months.
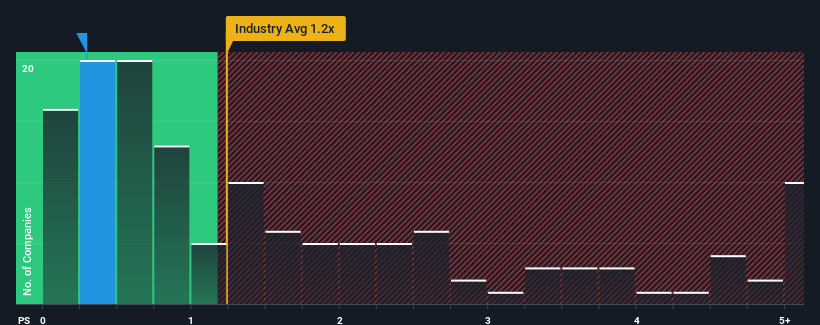
Even after such a large jump in price, there still wouldn't be many who think Shengli Oil & Gas Pipe Holdings' price-to-sales (or "P/S") ratio of 0.3x is worth a mention when it essentially matches the median P/S in Hong Kong's Energy Services industry. Although, it's not wise to simply ignore the P/S without explanation as investors may be disregarding a distinct opportunity or a costly mistake.
View our latest analysis for Shengli Oil & Gas Pipe Holdings
How Shengli Oil & Gas Pipe Holdings Has Been Performing
As an illustration, revenue has deteriorated at Shengli Oil & Gas Pipe Holdings over the last year, which is not ideal at all. Perhaps investors believe the recent revenue performance is enough to keep in line with the industry, which is keeping the P/S from dropping off. If not, then existing shareholders may be a little nervous about the viability of the share price.
Want the full picture on earnings, revenue and cash flow for the company? Then our free report on Shengli Oil & Gas Pipe Holdings will help you shine a light on its historical performance.Is There Some Revenue Growth Forecasted For Shengli Oil & Gas Pipe Holdings?
There's an inherent assumption that a company should be matching the industry for P/S ratios like Shengli Oil & Gas Pipe Holdings' to be considered reasonable.
Retrospectively, the last year delivered a frustrating 43% decrease to the company's top line. This means it has also seen a slide in revenue over the longer-term as revenue is down 31% in total over the last three years. Accordingly, shareholders would have felt downbeat about the medium-term rates of revenue growth.
In contrast to the company, the rest of the industry is expected to grow by 14% over the next year, which really puts the company's recent medium-term revenue decline into perspective.
In light of this, it's somewhat alarming that Shengli Oil & Gas Pipe Holdings' P/S sits in line with the majority of other companies. Apparently many investors in the company are way less bearish than recent times would indicate and aren't willing to let go of their stock right now. Only the boldest would assume these prices are sustainable as a continuation of recent revenue trends is likely to weigh on the share price eventually.
The Final Word
Shengli Oil & Gas Pipe Holdings appears to be back in favour with a solid price jump bringing its P/S back in line with other companies in the industry It's argued the price-to-sales ratio is an inferior measure of value within certain industries, but it can be a powerful business sentiment indicator.
Our look at Shengli Oil & Gas Pipe Holdings revealed its shrinking revenues over the medium-term haven't impacted the P/S as much as we anticipated, given the industry is set to grow. Even though it matches the industry, we're uncomfortable with the current P/S ratio, as this dismal revenue performance is unlikely to support a more positive sentiment for long. Unless the recent medium-term conditions improve markedly, investors will have a hard time accepting the share price as fair value.
We don't want to rain on the parade too much, but we did also find 2 warning signs for Shengli Oil & Gas Pipe Holdings (1 doesn't sit too well with us!) that you need to be mindful of.
If companies with solid past earnings growth is up your alley, you may wish to see this free collection of other companies with strong earnings growth and low P/E ratios.
New: Manage All Your Stock Portfolios in One Place
We've created the ultimate portfolio companion for stock investors, and it's free.
• Connect an unlimited number of Portfolios and see your total in one currency
• Be alerted to new Warning Signs or Risks via email or mobile
• Track the Fair Value of your stocks
Have feedback on this article? Concerned about the content? Get in touch with us directly. Alternatively, email editorial-team (at) simplywallst.com.
This article by Simply Wall St is general in nature. We provide commentary based on historical data and analyst forecasts only using an unbiased methodology and our articles are not intended to be financial advice. It does not constitute a recommendation to buy or sell any stock, and does not take account of your objectives, or your financial situation. We aim to bring you long-term focused analysis driven by fundamental data. Note that our analysis may not factor in the latest price-sensitive company announcements or qualitative material. Simply Wall St has no position in any stocks mentioned.
About SEHK:1080
Shengli Oil & Gas Pipe Holdings
An investment holding company, engages in the design, process, manufacture, and sale of welded pipes for oil and gas pipeline in Mainland China.
Adequate balance sheet and slightly overvalued.
