
Advertisement
- Hong Kong
- /
- Capital Markets
- /
- SEHK:8365
Revenues Working Against Hatcher Group Limited's (HKG:8365) Share Price Following 28% Dive

To the annoyance of some shareholders, Hatcher Group Limited (HKG:8365) shares are down a considerable 28% in the last month, which continues a horrid run for the company. The recent drop completes a disastrous twelve months for shareholders, who are sitting on a 96% loss during that time.
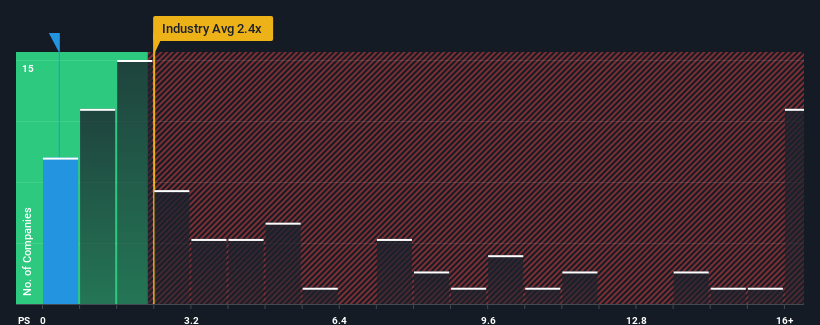
After such a large drop in price, Hatcher Group may be sending very bullish signals at the moment with its price-to-sales (or "P/S") ratio of 0.3x, since almost half of all companies in the Capital Markets industry in Hong Kong have P/S ratios greater than 2.4x and even P/S higher than 10x are not unusual. Although, it's not wise to just take the P/S at face value as there may be an explanation why it's so limited.
See our latest analysis for Hatcher Group
How Hatcher Group Has Been Performing
Hatcher Group has been doing a good job lately as it's been growing revenue at a solid pace. One possibility is that the P/S is low because investors think this respectable revenue growth might actually underperform the broader industry in the near future. If you like the company, you'd be hoping this isn't the case so that you could potentially pick up some stock while it's out of favour.
Although there are no analyst estimates available for Hatcher Group, take a look at this free data-rich visualisation to see how the company stacks up on earnings, revenue and cash flow.What Are Revenue Growth Metrics Telling Us About The Low P/S?
In order to justify its P/S ratio, Hatcher Group would need to produce anemic growth that's substantially trailing the industry.
Retrospectively, the last year delivered an exceptional 29% gain to the company's top line. The strong recent performance means it was also able to grow revenue by 62% in total over the last three years. Accordingly, shareholders would have definitely welcomed those medium-term rates of revenue growth.
Comparing the recent medium-term revenue trends against the industry's one-year growth forecast of 40% shows it's noticeably less attractive.
With this in consideration, it's easy to understand why Hatcher Group's P/S falls short of the mark set by its industry peers. Apparently many shareholders weren't comfortable holding on to something they believe will continue to trail the wider industry.
The Key Takeaway
Shares in Hatcher Group have plummeted and its P/S has followed suit. We'd say the price-to-sales ratio's power isn't primarily as a valuation instrument but rather to gauge current investor sentiment and future expectations.
Our examination of Hatcher Group confirms that the company's revenue trends over the past three-year years are a key factor in its low price-to-sales ratio, as we suspected, given they fall short of current industry expectations. Right now shareholders are accepting the low P/S as they concede future revenue probably won't provide any pleasant surprises. Unless the recent medium-term conditions improve, they will continue to form a barrier for the share price around these levels.
You need to take note of risks, for example - Hatcher Group has 3 warning signs (and 2 which shouldn't be ignored) we think you should know about.
Of course, profitable companies with a history of great earnings growth are generally safer bets. So you may wish to see this free collection of other companies that have reasonable P/E ratios and have grown earnings strongly.
Valuation is complex, but we're here to simplify it.
Discover if Hatcher Group might be undervalued or overvalued with our detailed analysis, featuring fair value estimates, potential risks, dividends, insider trades, and its financial condition.
Access Free AnalysisHave feedback on this article? Concerned about the content? Get in touch with us directly. Alternatively, email editorial-team (at) simplywallst.com.
This article by Simply Wall St is general in nature. We provide commentary based on historical data and analyst forecasts only using an unbiased methodology and our articles are not intended to be financial advice. It does not constitute a recommendation to buy or sell any stock, and does not take account of your objectives, or your financial situation. We aim to bring you long-term focused analysis driven by fundamental data. Note that our analysis may not factor in the latest price-sensitive company announcements or qualitative material. Simply Wall St has no position in any stocks mentioned.
About SEHK:8365
Hatcher Group
An investment holding company, provides financial services in Hong Kong, the People's Republic of China, and Canada.
Excellent balance sheet slight.
Market Insights


Advertisement
Community Narratives
Nike's Direct-to-Consumer Focus Will Drive Future Growth
Fair Value US$87.90|22.7% undervalued
UN
Community Contributor
Novo Nordisk will dominate GLP-1 market with Ozempic and Wegovy growth
Fair Value US$89.59|14.2% undervalued
BE
Community Contributor
Rheinmetall could get 20-25% of EU-NATO 3%-GDP defence spending
Fair Value €7.57k|82.8% undervalued
NO
Community Contributor