- Hong Kong
- /
- Diversified Financial
- /
- SEHK:3903
Hanhua Financial Holding Co., Ltd.'s (HKG:3903) 42% Share Price Surge Not Quite Adding Up


Those holding Hanhua Financial Holding Co., Ltd. (HKG:3903) shares would be relieved that the share price has rebounded 42% in the last thirty days, but it needs to keep going to repair the recent damage it has caused to investor portfolios. Notwithstanding the latest gain, the annual share price return of 4.9% isn't as impressive.
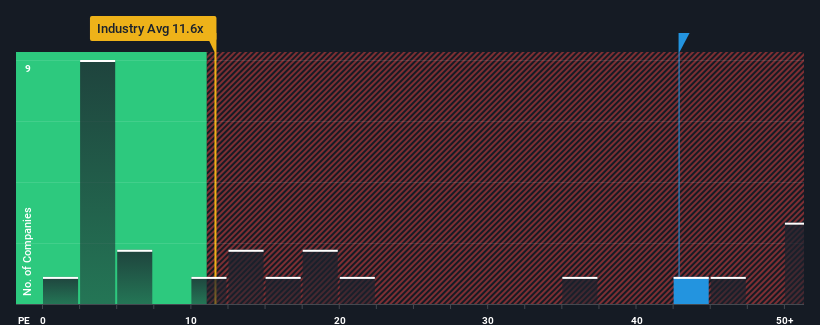
Following the firm bounce in price, Hanhua Financial Holding may be sending very bearish signals at the moment with a price-to-earnings (or "P/E") ratio of 42.8x, since almost half of all companies in Hong Kong have P/E ratios under 9x and even P/E's lower than 5x are not unusual. Nonetheless, we'd need to dig a little deeper to determine if there is a rational basis for the highly elevated P/E.
Hanhua Financial Holding certainly has been doing a great job lately as it's been growing earnings at a really rapid pace. The P/E is probably high because investors think this strong earnings growth will be enough to outperform the broader market in the near future. If not, then existing shareholders might be a little nervous about the viability of the share price.
Check out our latest analysis for Hanhua Financial Holding
What Are Growth Metrics Telling Us About The High P/E?
Hanhua Financial Holding's P/E ratio would be typical for a company that's expected to deliver very strong growth, and importantly, perform much better than the market.
Taking a look back first, we see that the company grew earnings per share by an impressive 159% last year. Still, incredibly EPS has fallen 79% in total from three years ago, which is quite disappointing. So unfortunately, we have to acknowledge that the company has not done a great job of growing earnings over that time.
In contrast to the company, the rest of the market is expected to grow by 20% over the next year, which really puts the company's recent medium-term earnings decline into perspective.
With this information, we find it concerning that Hanhua Financial Holding is trading at a P/E higher than the market. Apparently many investors in the company are way more bullish than recent times would indicate and aren't willing to let go of their stock at any price. Only the boldest would assume these prices are sustainable as a continuation of recent earnings trends is likely to weigh heavily on the share price eventually.
What We Can Learn From Hanhua Financial Holding's P/E?
Shares in Hanhua Financial Holding have built up some good momentum lately, which has really inflated its P/E. Using the price-to-earnings ratio alone to determine if you should sell your stock isn't sensible, however it can be a practical guide to the company's future prospects.
We've established that Hanhua Financial Holding currently trades on a much higher than expected P/E since its recent earnings have been in decline over the medium-term. Right now we are increasingly uncomfortable with the high P/E as this earnings performance is highly unlikely to support such positive sentiment for long. Unless the recent medium-term conditions improve markedly, it's very challenging to accept these prices as being reasonable.
It's always necessary to consider the ever-present spectre of investment risk. We've identified 3 warning signs with Hanhua Financial Holding (at least 1 which is significant), and understanding these should be part of your investment process.
It's important to make sure you look for a great company, not just the first idea you come across. So take a peek at this free list of interesting companies with strong recent earnings growth (and a low P/E).
Valuation is complex, but we're here to simplify it.
Discover if Hanhua Financial Holding might be undervalued or overvalued with our detailed analysis, featuring fair value estimates, potential risks, dividends, insider trades, and its financial condition.
Access Free AnalysisHave feedback on this article? Concerned about the content? Get in touch with us directly. Alternatively, email editorial-team (at) simplywallst.com.
This article by Simply Wall St is general in nature. We provide commentary based on historical data and analyst forecasts only using an unbiased methodology and our articles are not intended to be financial advice. It does not constitute a recommendation to buy or sell any stock, and does not take account of your objectives, or your financial situation. We aim to bring you long-term focused analysis driven by fundamental data. Note that our analysis may not factor in the latest price-sensitive company announcements or qualitative material. Simply Wall St has no position in any stocks mentioned.
About SEHK:3903
Hanhua Financial Holding
Provides financial services in the People’s Republic of China.
Proven track record with adequate balance sheet.

