- Hong Kong
- /
- Consumer Finance
- /
- SEHK:2858
Strong week for Yixin Group (HKG:2858) shareholders doesn't alleviate pain of three-year loss


Yixin Group Limited (HKG:2858) shareholders should be happy to see the share price up 12% in the last month. But that is small recompense for the exasperating returns over three years. Indeed, the share price is down a tragic 60% in the last three years. So the improvement may be a real relief to some. After all, could be that the fall was overdone.
On a more encouraging note the company has added HK$391m to its market cap in just the last 7 days, so let's see if we can determine what's driven the three-year loss for shareholders.
See our latest analysis for Yixin Group
In his essay The Superinvestors of Graham-and-Doddsville Warren Buffett described how share prices do not always rationally reflect the value of a business. One imperfect but simple way to consider how the market perception of a company has shifted is to compare the change in the earnings per share (EPS) with the share price movement.
Yixin Group became profitable within the last five years. We would usually expect to see the share price rise as a result. So given the share price is down it's worth checking some other metrics too.
Given the healthiness of the dividend payments, we doubt that they've concerned the market. It's good to see that Yixin Group has increased its revenue over the last three years. But it's not clear to us why the share price is down. It might be worth diving deeper into the fundamentals, lest an opportunity goes begging.
The company's revenue and earnings (over time) are depicted in the image below (click to see the exact numbers).
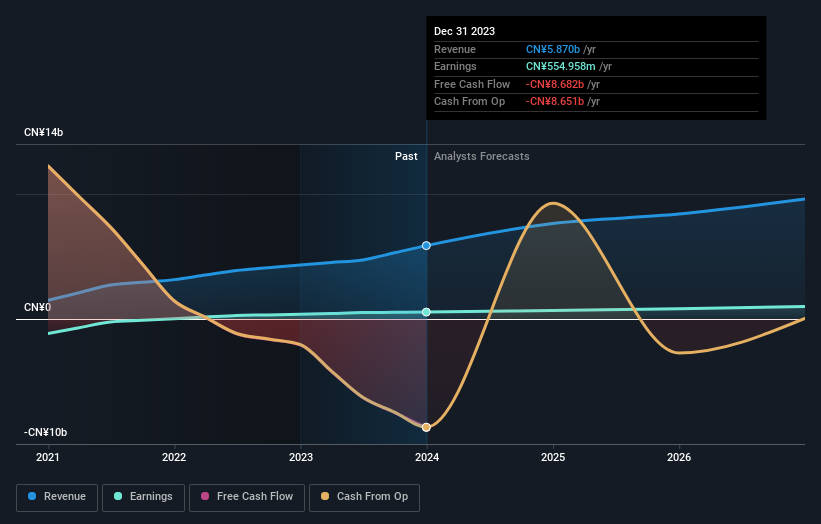
We know that Yixin Group has improved its bottom line over the last three years, but what does the future have in store? If you are thinking of buying or selling Yixin Group stock, you should check out this FREE detailed report on its balance sheet.
What About Dividends?
As well as measuring the share price return, investors should also consider the total shareholder return (TSR). The TSR is a return calculation that accounts for the value of cash dividends (assuming that any dividend received was reinvested) and the calculated value of any discounted capital raisings and spin-offs. It's fair to say that the TSR gives a more complete picture for stocks that pay a dividend. We note that for Yixin Group the TSR over the last 3 years was -57%, which is better than the share price return mentioned above. And there's no prize for guessing that the dividend payments largely explain the divergence!
A Different Perspective
We regret to report that Yixin Group shareholders are down 5.9% for the year (even including dividends). Unfortunately, that's worse than the broader market decline of 0.6%. However, it could simply be that the share price has been impacted by broader market jitters. It might be worth keeping an eye on the fundamentals, in case there's a good opportunity. Unfortunately, longer term shareholders are suffering worse, given the loss of 8% doled out over the last five years. We would want clear information suggesting the company will grow, before taking the view that the share price will stabilize. It's always interesting to track share price performance over the longer term. But to understand Yixin Group better, we need to consider many other factors. Case in point: We've spotted 3 warning signs for Yixin Group you should be aware of, and 2 of them don't sit too well with us.
But note: Yixin Group may not be the best stock to buy. So take a peek at this free list of interesting companies with past earnings growth (and further growth forecast).
Please note, the market returns quoted in this article reflect the market weighted average returns of stocks that currently trade on Hong Kong exchanges.
New: Manage All Your Stock Portfolios in One Place
We've created the ultimate portfolio companion for stock investors, and it's free.
• Connect an unlimited number of Portfolios and see your total in one currency
• Be alerted to new Warning Signs or Risks via email or mobile
• Track the Fair Value of your stocks
Have feedback on this article? Concerned about the content? Get in touch with us directly. Alternatively, email editorial-team (at) simplywallst.com.
This article by Simply Wall St is general in nature. We provide commentary based on historical data and analyst forecasts only using an unbiased methodology and our articles are not intended to be financial advice. It does not constitute a recommendation to buy or sell any stock, and does not take account of your objectives, or your financial situation. We aim to bring you long-term focused analysis driven by fundamental data. Note that our analysis may not factor in the latest price-sensitive company announcements or qualitative material. Simply Wall St has no position in any stocks mentioned.
About SEHK:2858
Yixin Group
Operates as an online automobile finance transaction platform in China.
Fair value with moderate growth potential.

