- Hong Kong
- /
- Diversified Financial
- /
- SEHK:2666
Genertec Universal Medical Group's (HKG:2666) 27% return outpaced the company's earnings growth over the same one-year period


On average, over time, stock markets tend to rise higher. This makes investing attractive. But not every stock you buy will perform as well as the overall market. Unfortunately for shareholders, while the Genertec Universal Medical Group Company Limited (HKG:2666) share price is up 17% in the last year, that falls short of the market return. In contrast, the longer term returns are negative, since the share price is 7.6% lower than it was three years ago.
The past week has proven to be lucrative for Genertec Universal Medical Group investors, so let's see if fundamentals drove the company's one-year performance.
See our latest analysis for Genertec Universal Medical Group
While markets are a powerful pricing mechanism, share prices reflect investor sentiment, not just underlying business performance. One way to examine how market sentiment has changed over time is to look at the interaction between a company's share price and its earnings per share (EPS).
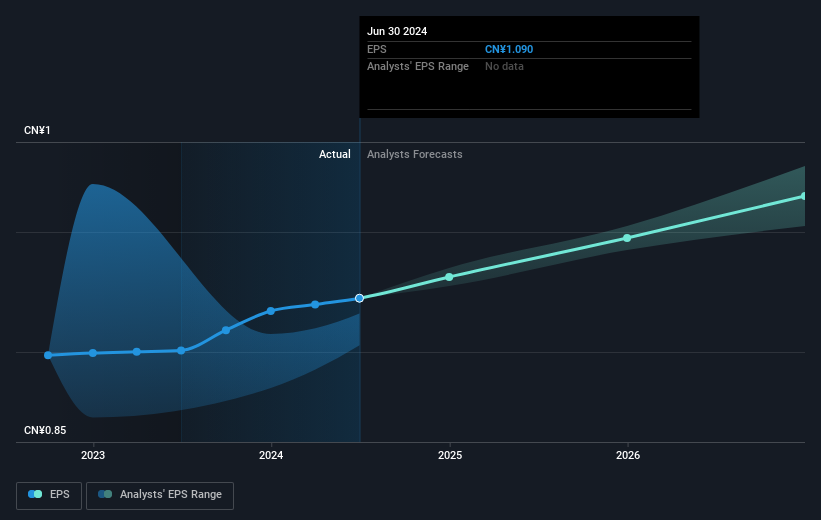
Genertec Universal Medical Group was able to grow EPS by 8.7% in the last twelve months. The share price gain of 17% certainly outpaced the EPS growth. This indicates that the market is now more optimistic about the stock.
The image below shows how EPS has tracked over time (if you click on the image you can see greater detail).
Before buying or selling a stock, we always recommend a close examination of historic growth trends, available here.
What About Dividends?
As well as measuring the share price return, investors should also consider the total shareholder return (TSR). The TSR incorporates the value of any spin-offs or discounted capital raisings, along with any dividends, based on the assumption that the dividends are reinvested. It's fair to say that the TSR gives a more complete picture for stocks that pay a dividend. As it happens, Genertec Universal Medical Group's TSR for the last 1 year was 27%, which exceeds the share price return mentioned earlier. And there's no prize for guessing that the dividend payments largely explain the divergence!
A Different Perspective
Genertec Universal Medical Group shareholders gained a total return of 27% during the year. Unfortunately this falls short of the market return. The silver lining is that the gain was actually better than the average annual return of 5% per year over five year. It is possible that returns will improve along with the business fundamentals. It's always interesting to track share price performance over the longer term. But to understand Genertec Universal Medical Group better, we need to consider many other factors. For instance, we've identified 1 warning sign for Genertec Universal Medical Group that you should be aware of.
If you would prefer to check out another company -- one with potentially superior financials -- then do not miss this free list of companies that have proven they can grow earnings.
Please note, the market returns quoted in this article reflect the market weighted average returns of stocks that currently trade on Hong Kong exchanges.
New: Manage All Your Stock Portfolios in One Place
We've created the ultimate portfolio companion for stock investors, and it's free.
• Connect an unlimited number of Portfolios and see your total in one currency
• Be alerted to new Warning Signs or Risks via email or mobile
• Track the Fair Value of your stocks
Have feedback on this article? Concerned about the content? Get in touch with us directly. Alternatively, email editorial-team (at) simplywallst.com.
This article by Simply Wall St is general in nature. We provide commentary based on historical data and analyst forecasts only using an unbiased methodology and our articles are not intended to be financial advice. It does not constitute a recommendation to buy or sell any stock, and does not take account of your objectives, or your financial situation. We aim to bring you long-term focused analysis driven by fundamental data. Note that our analysis may not factor in the latest price-sensitive company announcements or qualitative material. Simply Wall St has no position in any stocks mentioned.
About SEHK:2666
Genertec Universal Medical Group
Offers financing and advisory services in the People’s Republic of China.
Undervalued with solid track record.
Similar Companies
Market Insights

Community Narratives

