- Hong Kong
- /
- Capital Markets
- /
- SEHK:1697
Subdued Growth No Barrier To Shandong International Trust Co., Ltd. (HKG:1697) With Shares Advancing 29%


Shandong International Trust Co., Ltd. (HKG:1697) shares have had a really impressive month, gaining 29% after a shaky period beforehand. Unfortunately, the gains of the last month did little to right the losses of the last year with the stock still down 12% over that time.
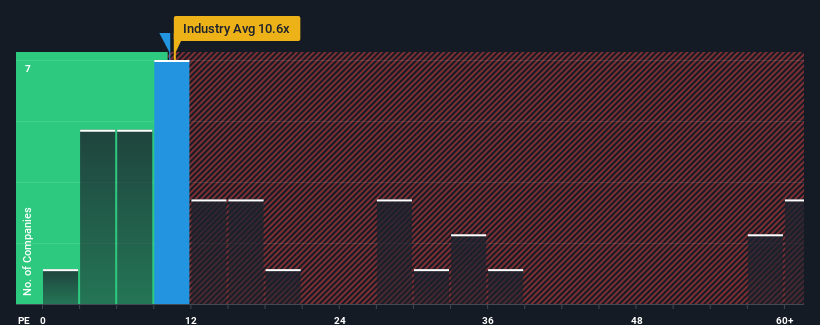
Although its price has surged higher, there still wouldn't be many who think Shandong International Trust's price-to-earnings (or "P/E") ratio of 10.2x is worth a mention when the median P/E in Hong Kong is similar at about 10x. While this might not raise any eyebrows, if the P/E ratio is not justified investors could be missing out on a potential opportunity or ignoring looming disappointment.
For example, consider that Shandong International Trust's financial performance has been poor lately as its earnings have been in decline. It might be that many expect the company to put the disappointing earnings performance behind them over the coming period, which has kept the P/E from falling. If you like the company, you'd at least be hoping this is the case so that you could potentially pick up some stock while it's not quite in favour.
Check out our latest analysis for Shandong International Trust
Does Growth Match The P/E?
In order to justify its P/E ratio, Shandong International Trust would need to produce growth that's similar to the market.
If we review the last year of earnings, dishearteningly the company's profits fell to the tune of 43%. The last three years don't look nice either as the company has shrunk EPS by 75% in aggregate. Therefore, it's fair to say the earnings growth recently has been undesirable for the company.
In contrast to the company, the rest of the market is expected to grow by 21% over the next year, which really puts the company's recent medium-term earnings decline into perspective.
With this information, we find it concerning that Shandong International Trust is trading at a fairly similar P/E to the market. It seems most investors are ignoring the recent poor growth rate and are hoping for a turnaround in the company's business prospects. There's a good chance existing shareholders are setting themselves up for future disappointment if the P/E falls to levels more in line with the recent negative growth rates.
The Final Word
Its shares have lifted substantially and now Shandong International Trust's P/E is also back up to the market median. We'd say the price-to-earnings ratio's power isn't primarily as a valuation instrument but rather to gauge current investor sentiment and future expectations.
We've established that Shandong International Trust currently trades on a higher than expected P/E since its recent earnings have been in decline over the medium-term. When we see earnings heading backwards and underperforming the market forecasts, we suspect the share price is at risk of declining, sending the moderate P/E lower. If recent medium-term earnings trends continue, it will place shareholders' investments at risk and potential investors in danger of paying an unnecessary premium.
It's always necessary to consider the ever-present spectre of investment risk. We've identified 3 warning signs with Shandong International Trust (at least 2 which don't sit too well with us), and understanding these should be part of your investment process.
You might be able to find a better investment than Shandong International Trust. If you want a selection of possible candidates, check out this free list of interesting companies that trade on a low P/E (but have proven they can grow earnings).
If you're looking to trade Shandong International Trust, open an account with the lowest-cost platform trusted by professionals, Interactive Brokers.
With clients in over 200 countries and territories, and access to 160 markets, IBKR lets you trade stocks, options, futures, forex, bonds and funds from a single integrated account.
Enjoy no hidden fees, no account minimums, and FX conversion rates as low as 0.03%, far better than what most brokers offer.
Sponsored ContentNew: Manage All Your Stock Portfolios in One Place
We've created the ultimate portfolio companion for stock investors, and it's free.
• Connect an unlimited number of Portfolios and see your total in one currency
• Be alerted to new Warning Signs or Risks via email or mobile
• Track the Fair Value of your stocks
Have feedback on this article? Concerned about the content? Get in touch with us directly. Alternatively, email editorial-team (at) simplywallst.com.
This article by Simply Wall St is general in nature. We provide commentary based on historical data and analyst forecasts only using an unbiased methodology and our articles are not intended to be financial advice. It does not constitute a recommendation to buy or sell any stock, and does not take account of your objectives, or your financial situation. We aim to bring you long-term focused analysis driven by fundamental data. Note that our analysis may not factor in the latest price-sensitive company announcements or qualitative material. Simply Wall St has no position in any stocks mentioned.
About SEHK:1697
Shandong International Trust
A non-bank financial institution, provides various trust services in the People’s Republic of China.
Excellent balance sheet and slightly overvalued.
Similar Companies
Market Insights

Community Narratives


