- Hong Kong
- /
- Capital Markets
- /
- SEHK:1697
Shandong International Trust (HKG:1697) stock falls 13% in past week as five-year earnings and shareholder returns continue downward trend


Long term investing is the way to go, but that doesn't mean you should hold every stock forever. It hits us in the gut when we see fellow investors suffer a loss. Imagine if you held Shandong International Trust Co., Ltd. (HKG:1697) for half a decade as the share price tanked 80%. And the share price decline continued over the last week, dropping some 13%. We really hope anyone holding through that price crash has a diversified portfolio. Even when you lose money, you don't have to lose the lesson.
After losing 13% this past week, it's worth investigating the company's fundamentals to see what we can infer from past performance.
See our latest analysis for Shandong International Trust
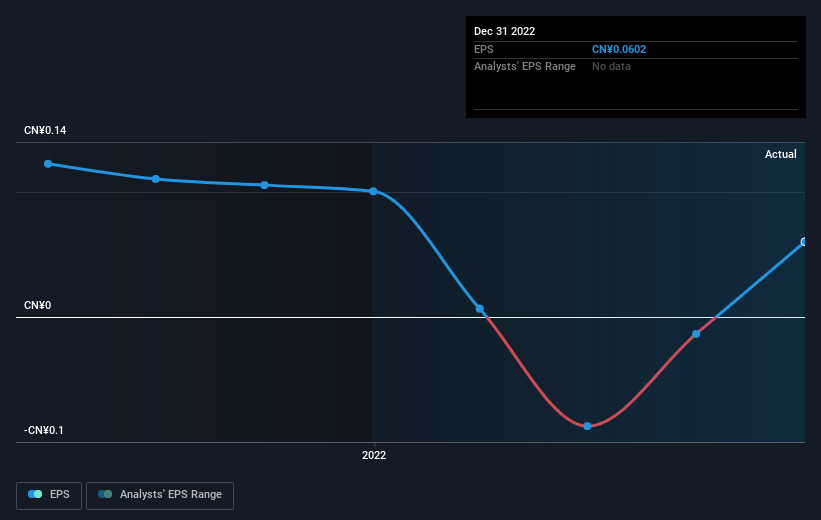
While markets are a powerful pricing mechanism, share prices reflect investor sentiment, not just underlying business performance. One way to examine how market sentiment has changed over time is to look at the interaction between a company's share price and its earnings per share (EPS).
Looking back five years, both Shandong International Trust's share price and EPS declined; the latter at a rate of 24% per year. This change in EPS is reasonably close to the 28% average annual decrease in the share price. That suggests that the market sentiment around the company hasn't changed much over that time. So it's fair to say the share price has been responding to changes in EPS.
You can see below how EPS has changed over time (discover the exact values by clicking on the image).
It might be well worthwhile taking a look at our free report on Shandong International Trust's earnings, revenue and cash flow.
What About The Total Shareholder Return (TSR)?
We'd be remiss not to mention the difference between Shandong International Trust's total shareholder return (TSR) and its share price return. The TSR attempts to capture the value of dividends (as if they were reinvested) as well as any spin-offs or discounted capital raisings offered to shareholders. Shandong International Trust's TSR of was a loss of 76% for the 5 years. That wasn't as bad as its share price return, because it has paid dividends.
A Different Perspective
While the broader market lost about 8.0% in the twelve months, Shandong International Trust shareholders did even worse, losing 13%. Having said that, it's inevitable that some stocks will be oversold in a falling market. The key is to keep your eyes on the fundamental developments. Unfortunately, longer term shareholders are suffering worse, given the loss of 12% doled out over the last five years. We would want clear information suggesting the company will grow, before taking the view that the share price will stabilize. I find it very interesting to look at share price over the long term as a proxy for business performance. But to truly gain insight, we need to consider other information, too. Consider for instance, the ever-present spectre of investment risk. We've identified 3 warning signs with Shandong International Trust (at least 2 which are concerning) , and understanding them should be part of your investment process.
If you like to buy stocks alongside management, then you might just love this free list of companies. (Hint: insiders have been buying them).
Please note, the market returns quoted in this article reflect the market weighted average returns of stocks that currently trade on Hong Kong exchanges.
New: Manage All Your Stock Portfolios in One Place
We've created the ultimate portfolio companion for stock investors, and it's free.
• Connect an unlimited number of Portfolios and see your total in one currency
• Be alerted to new Warning Signs or Risks via email or mobile
• Track the Fair Value of your stocks
Have feedback on this article? Concerned about the content? Get in touch with us directly. Alternatively, email editorial-team (at) simplywallst.com.
This article by Simply Wall St is general in nature. We provide commentary based on historical data and analyst forecasts only using an unbiased methodology and our articles are not intended to be financial advice. It does not constitute a recommendation to buy or sell any stock, and does not take account of your objectives, or your financial situation. We aim to bring you long-term focused analysis driven by fundamental data. Note that our analysis may not factor in the latest price-sensitive company announcements or qualitative material. Simply Wall St has no position in any stocks mentioned.
About SEHK:1697
Shandong International Trust
A non-bank financial institution, provides various trust services in the People’s Republic of China.
Excellent balance sheet and slightly overvalued.
Similar Companies
Market Insights

Community Narratives

