
Advertisement
- Hong Kong
- /
- Diversified Financial
- /
- SEHK:1039
Changyou International Group Limited (HKG:1039) Shares Fly 27% But Investors Aren't Buying For Growth

Changyou International Group Limited (HKG:1039) shares have had a really impressive month, gaining 27% after a shaky period beforehand. Unfortunately, the gains of the last month did little to right the losses of the last year with the stock still down 49% over that time.
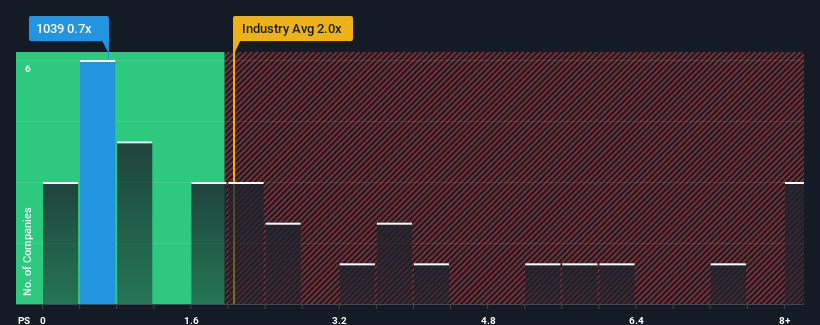
Although its price has surged higher, Changyou International Group may still be sending buy signals at present with its price-to-sales (or "P/S") ratio of 0.7x, considering almost half of all companies in the Diversified Financial industry in Hong Kong have P/S ratios greater than 2x and even P/S higher than 5x aren't out of the ordinary. However, the P/S might be low for a reason and it requires further investigation to determine if it's justified.
See our latest analysis for Changyou International Group
What Does Changyou International Group's Recent Performance Look Like?
For example, consider that Changyou International Group's financial performance has been poor lately as its revenue has been in decline. Perhaps the market believes the recent revenue performance isn't good enough to keep up the industry, causing the P/S ratio to suffer. Those who are bullish on Changyou International Group will be hoping that this isn't the case so that they can pick up the stock at a lower valuation.
We don't have analyst forecasts, but you can see how recent trends are setting up the company for the future by checking out our free report on Changyou International Group's earnings, revenue and cash flow.How Is Changyou International Group's Revenue Growth Trending?
There's an inherent assumption that a company should underperform the industry for P/S ratios like Changyou International Group's to be considered reasonable.
Retrospectively, the last year delivered a frustrating 28% decrease to the company's top line. This means it has also seen a slide in revenue over the longer-term as revenue is down 19% in total over the last three years. Therefore, it's fair to say the revenue growth recently has been undesirable for the company.
Weighing that medium-term revenue trajectory against the broader industry's one-year forecast for expansion of 15% shows it's an unpleasant look.
With this information, we are not surprised that Changyou International Group is trading at a P/S lower than the industry. Nonetheless, there's no guarantee the P/S has reached a floor yet with revenue going in reverse. There's potential for the P/S to fall to even lower levels if the company doesn't improve its top-line growth.
The Final Word
The latest share price surge wasn't enough to lift Changyou International Group's P/S close to the industry median. Typically, we'd caution against reading too much into price-to-sales ratios when settling on investment decisions, though it can reveal plenty about what other market participants think about the company.
Our examination of Changyou International Group confirms that the company's shrinking revenue over the past medium-term is a key factor in its low price-to-sales ratio, given the industry is projected to grow. Right now shareholders are accepting the low P/S as they concede future revenue probably won't provide any pleasant surprises either. Given the current circumstances, it seems unlikely that the share price will experience any significant movement in either direction in the near future if recent medium-term revenue trends persist.
It is also worth noting that we have found 2 warning signs for Changyou International Group (1 is a bit unpleasant!) that you need to take into consideration.
If companies with solid past earnings growth is up your alley, you may wish to see this free collection of other companies with strong earnings growth and low P/E ratios.
New: AI Stock Screener & Alerts
Our new AI Stock Screener scans the market every day to uncover opportunities.
• Dividend Powerhouses (3%+ Yield)
• Undervalued Small Caps with Insider Buying
• High growth Tech and AI Companies
Or build your own from over 50 metrics.
Have feedback on this article? Concerned about the content? Get in touch with us directly. Alternatively, email editorial-team (at) simplywallst.com.
This article by Simply Wall St is general in nature. We provide commentary based on historical data and analyst forecasts only using an unbiased methodology and our articles are not intended to be financial advice. It does not constitute a recommendation to buy or sell any stock, and does not take account of your objectives, or your financial situation. We aim to bring you long-term focused analysis driven by fundamental data. Note that our analysis may not factor in the latest price-sensitive company announcements or qualitative material. Simply Wall St has no position in any stocks mentioned.
About SEHK:1039
Changyou International Group
An investment holding company, engages in the digital points business primarily in the People’s Republic of China.
Good value slight.
Market Insights

Advertisement
Community Narratives
Pinterest will surge as advertising innovations ignite revenue growth
Fair Value US$42.63|27.0% undervalued
BR
Community Contributor
Brambles' Revenue Set to Climb 14% with Profit Margins Following
Fair Value AU$21.90|5.9% overvalued
RO
Community Contributor
Challenging Future for STG as Organic Sales Decline by 8.8%
Fair Value DKK 116.13|26.8% undervalued
KA
Community Contributor