
Advertisement
- Hong Kong
- /
- Hospitality
- /
- SEHK:9922
Jiumaojiu International Holdings Limited (HKG:9922) Shares Slammed 32% But Getting In Cheap Might Be Difficult Regardless

Unfortunately for some shareholders, the Jiumaojiu International Holdings Limited (HKG:9922) share price has dived 32% in the last thirty days, prolonging recent pain. For any long-term shareholders, the last month ends a year to forget by locking in a 82% share price decline.
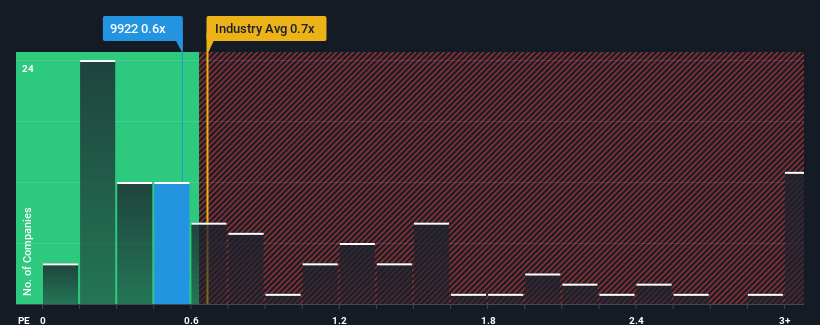
In spite of the heavy fall in price, it's still not a stretch to say that Jiumaojiu International Holdings' price-to-sales (or "P/S") ratio of 0.6x right now seems quite "middle-of-the-road" compared to the Hospitality industry in Hong Kong, where the median P/S ratio is around 0.7x. However, investors might be overlooking a clear opportunity or potential setback if there is no rational basis for the P/S.
Check out our latest analysis for Jiumaojiu International Holdings
What Does Jiumaojiu International Holdings' Recent Performance Look Like?
With revenue growth that's inferior to most other companies of late, Jiumaojiu International Holdings has been relatively sluggish. Perhaps the market is expecting future revenue performance to lift, which has kept the P/S from declining. You'd really hope so, otherwise you're paying a relatively elevated price for a company with this sort of growth profile.
Want the full picture on analyst estimates for the company? Then our free report on Jiumaojiu International Holdings will help you uncover what's on the horizon.What Are Revenue Growth Metrics Telling Us About The P/S?
In order to justify its P/S ratio, Jiumaojiu International Holdings would need to produce growth that's similar to the industry.
Retrospectively, the last year delivered an exceptional 49% gain to the company's top line. The latest three year period has also seen an excellent 120% overall rise in revenue, aided by its short-term performance. So we can start by confirming that the company has done a great job of growing revenue over that time.
Turning to the outlook, the next three years should generate growth of 16% each year as estimated by the analysts watching the company. Meanwhile, the rest of the industry is forecast to expand by 15% per annum, which is not materially different.
With this information, we can see why Jiumaojiu International Holdings is trading at a fairly similar P/S to the industry. It seems most investors are expecting to see average future growth and are only willing to pay a moderate amount for the stock.
What We Can Learn From Jiumaojiu International Holdings' P/S?
Jiumaojiu International Holdings' plummeting stock price has brought its P/S back to a similar region as the rest of the industry. We'd say the price-to-sales ratio's power isn't primarily as a valuation instrument but rather to gauge current investor sentiment and future expectations.
Our look at Jiumaojiu International Holdings' revenue growth estimates show that its P/S is about what we expect, as both metrics follow closely with the industry averages. Right now shareholders are comfortable with the P/S as they are quite confident future revenue won't throw up any surprises. If all things remain constant, the possibility of a drastic share price movement remains fairly remote.
There are also other vital risk factors to consider before investing and we've discovered 1 warning sign for Jiumaojiu International Holdings that you should be aware of.
If companies with solid past earnings growth is up your alley, you may wish to see this free collection of other companies with strong earnings growth and low P/E ratios.
New: Manage All Your Stock Portfolios in One Place
We've created the ultimate portfolio companion for stock investors, and it's free.
• Connect an unlimited number of Portfolios and see your total in one currency
• Be alerted to new Warning Signs or Risks via email or mobile
• Track the Fair Value of your stocks
Have feedback on this article? Concerned about the content? Get in touch with us directly. Alternatively, email editorial-team (at) simplywallst.com.
This article by Simply Wall St is general in nature. We provide commentary based on historical data and analyst forecasts only using an unbiased methodology and our articles are not intended to be financial advice. It does not constitute a recommendation to buy or sell any stock, and does not take account of your objectives, or your financial situation. We aim to bring you long-term focused analysis driven by fundamental data. Note that our analysis may not factor in the latest price-sensitive company announcements or qualitative material. Simply Wall St has no position in any stocks mentioned.
About SEHK:9922
Jiumaojiu International Holdings
Engages in managing and operating Chinese cuisine restaurant brands in the People’s Republic of China, Singapore, Canada, Malaysia, Thailand, and the United States.
Flawless balance sheet with solid track record.
Market Insights


Advertisement
Community Narratives
Nike's Direct-to-Consumer Focus Will Drive Future Growth
Fair Value US$87.90|18.2% undervalued
UN
Community Contributor
Novo Nordisk will dominate GLP-1 market with Ozempic and Wegovy growth
Fair Value US$89.59|12.1% undervalued
BE
Community Contributor
Rheinmetall could get 20-25% of EU-NATO 3%-GDP defence spending
Fair Value €7.57k|82.8% undervalued
NO
Community Contributor