- Hong Kong
- /
- Hospitality
- /
- SEHK:880
Optimistic Investors Push SJM Holdings Limited (HKG:880) Shares Up 39% But Growth Is Lacking


SJM Holdings Limited (HKG:880) shareholders would be excited to see that the share price has had a great month, posting a 39% gain and recovering from prior weakness. Looking further back, the 11% rise over the last twelve months isn't too bad notwithstanding the strength over the last 30 days.
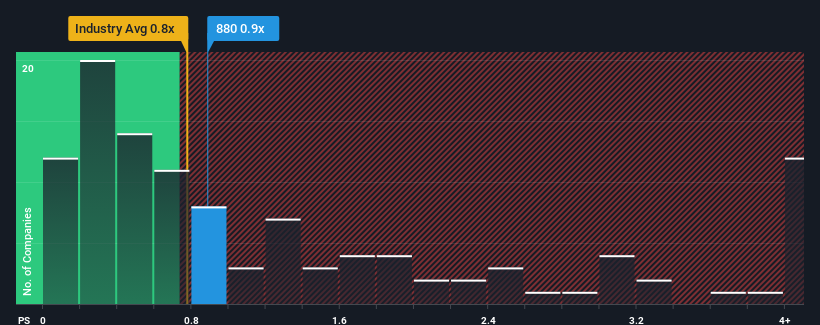
Although its price has surged higher, there still wouldn't be many who think SJM Holdings' price-to-sales (or "P/S") ratio of 0.9x is worth a mention when the median P/S in Hong Kong's Hospitality industry is similar at about 0.8x. Although, it's not wise to simply ignore the P/S without explanation as investors may be disregarding a distinct opportunity or a costly mistake.
View our latest analysis for SJM Holdings
What Does SJM Holdings' P/S Mean For Shareholders?
SJM Holdings certainly has been doing a good job lately as it's been growing revenue more than most other companies. Perhaps the market is expecting this level of performance to taper off, keeping the P/S from soaring. If you like the company, you'd be hoping this isn't the case so that you could potentially pick up some stock while it's not quite in favour.
Keen to find out how analysts think SJM Holdings' future stacks up against the industry? In that case, our free report is a great place to start.How Is SJM Holdings' Revenue Growth Trending?
There's an inherent assumption that a company should be matching the industry for P/S ratios like SJM Holdings' to be considered reasonable.
Taking a look back first, we see that the company grew revenue by an impressive 119% last year. Pleasingly, revenue has also lifted 212% in aggregate from three years ago, thanks to the last 12 months of growth. So we can start by confirming that the company has done a great job of growing revenue over that time.
Shifting to the future, estimates from the analysts covering the company suggest revenue should grow by 11% per year over the next three years. Meanwhile, the rest of the industry is forecast to expand by 14% each year, which is noticeably more attractive.
With this information, we find it interesting that SJM Holdings is trading at a fairly similar P/S compared to the industry. It seems most investors are ignoring the fairly limited growth expectations and are willing to pay up for exposure to the stock. These shareholders may be setting themselves up for future disappointment if the P/S falls to levels more in line with the growth outlook.
What We Can Learn From SJM Holdings' P/S?
SJM Holdings appears to be back in favour with a solid price jump bringing its P/S back in line with other companies in the industry It's argued the price-to-sales ratio is an inferior measure of value within certain industries, but it can be a powerful business sentiment indicator.
When you consider that SJM Holdings' revenue growth estimates are fairly muted compared to the broader industry, it's easy to see why we consider it unexpected to be trading at its current P/S ratio. When we see companies with a relatively weaker revenue outlook compared to the industry, we suspect the share price is at risk of declining, sending the moderate P/S lower. A positive change is needed in order to justify the current price-to-sales ratio.
Plus, you should also learn about this 1 warning sign we've spotted with SJM Holdings.
It's important to make sure you look for a great company, not just the first idea you come across. So if growing profitability aligns with your idea of a great company, take a peek at this free list of interesting companies with strong recent earnings growth (and a low P/E).
If you're looking to trade SJM Holdings, open an account with the lowest-cost platform trusted by professionals, Interactive Brokers.
With clients in over 200 countries and territories, and access to 160 markets, IBKR lets you trade stocks, options, futures, forex, bonds and funds from a single integrated account.
Enjoy no hidden fees, no account minimums, and FX conversion rates as low as 0.03%, far better than what most brokers offer.
Sponsored ContentNew: Manage All Your Stock Portfolios in One Place
We've created the ultimate portfolio companion for stock investors, and it's free.
• Connect an unlimited number of Portfolios and see your total in one currency
• Be alerted to new Warning Signs or Risks via email or mobile
• Track the Fair Value of your stocks
Have feedback on this article? Concerned about the content? Get in touch with us directly. Alternatively, email editorial-team (at) simplywallst.com.
This article by Simply Wall St is general in nature. We provide commentary based on historical data and analyst forecasts only using an unbiased methodology and our articles are not intended to be financial advice. It does not constitute a recommendation to buy or sell any stock, and does not take account of your objectives, or your financial situation. We aim to bring you long-term focused analysis driven by fundamental data. Note that our analysis may not factor in the latest price-sensitive company announcements or qualitative material. Simply Wall St has no position in any stocks mentioned.
About SEHK:880
SJM Holdings
An investment holding company, owns, develops, and operates casinos and related facilities in Macau.
Undervalued with moderate growth potential.

