
Advertisement
- Hong Kong
- /
- Hospitality
- /
- SEHK:8069
Why Investors Shouldn't Be Surprised By Flydoo Technology Holding Limited's (HKG:8069) 28% Share Price Plunge
Flydoo Technology Holding Limited (HKG:8069) shares have had a horrible month, losing 28% after a relatively good period beforehand. The recent drop completes a disastrous twelve months for shareholders, who are sitting on a 62% loss during that time.
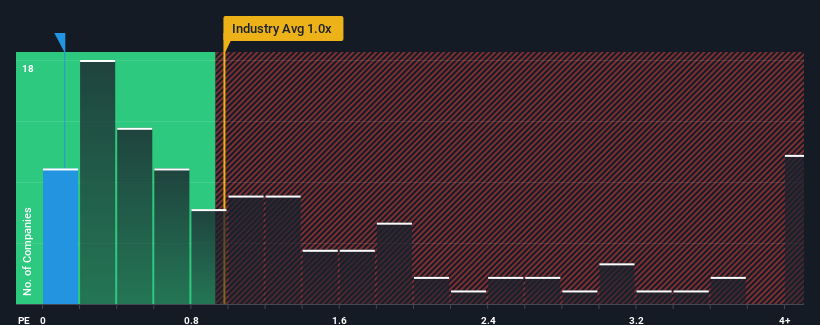
Since its price has dipped substantially, Flydoo Technology Holding may be sending bullish signals at the moment with its price-to-sales (or "P/S") ratio of 0.1x, since almost half of all companies in the Hospitality industry in Hong Kong have P/S ratios greater than 1x and even P/S higher than 3x are not unusual. Nonetheless, we'd need to dig a little deeper to determine if there is a rational basis for the reduced P/S.
Check out our latest analysis for Flydoo Technology Holding
What Does Flydoo Technology Holding's P/S Mean For Shareholders?
With revenue growth that's exceedingly strong of late, Flydoo Technology Holding has been doing very well. One possibility is that the P/S ratio is low because investors think this strong revenue growth might actually underperform the broader industry in the near future. If that doesn't eventuate, then existing shareholders have reason to be quite optimistic about the future direction of the share price.
Want the full picture on earnings, revenue and cash flow for the company? Then our free report on Flydoo Technology Holding will help you shine a light on its historical performance.Do Revenue Forecasts Match The Low P/S Ratio?
Flydoo Technology Holding's P/S ratio would be typical for a company that's only expected to deliver limited growth, and importantly, perform worse than the industry.
Taking a look back first, we see that the company's revenues underwent some rampant growth over the last 12 months. The latest three year period has also seen an excellent 154% overall rise in revenue, aided by its incredible short-term performance. Therefore, it's fair to say the revenue growth recently has been superb for the company.
Comparing the recent medium-term revenue trends against the industry's one-year growth forecast of 41% shows it's noticeably less attractive.
With this information, we can see why Flydoo Technology Holding is trading at a P/S lower than the industry. It seems most investors are expecting to see the recent limited growth rates continue into the future and are only willing to pay a reduced amount for the stock.
The Final Word
Flydoo Technology Holding's P/S has taken a dip along with its share price. Using the price-to-sales ratio alone to determine if you should sell your stock isn't sensible, however it can be a practical guide to the company's future prospects.
In line with expectations, Flydoo Technology Holding maintains its low P/S on the weakness of its recent three-year growth being lower than the wider industry forecast. At this stage investors feel the potential for an improvement in revenue isn't great enough to justify a higher P/S ratio. Unless the recent medium-term conditions improve, they will continue to form a barrier for the share price around these levels.
It is also worth noting that we have found 4 warning signs for Flydoo Technology Holding (1 can't be ignored!) that you need to take into consideration.
If companies with solid past earnings growth is up your alley, you may wish to see this free collection of other companies with strong earnings growth and low P/E ratios.
New: AI Stock Screener & Alerts
Our new AI Stock Screener scans the market every day to uncover opportunities.
• Dividend Powerhouses (3%+ Yield)
• Undervalued Small Caps with Insider Buying
• High growth Tech and AI Companies
Or build your own from over 50 metrics.
Have feedback on this article? Concerned about the content? Get in touch with us directly. Alternatively, email editorial-team (at) simplywallst.com.
This article by Simply Wall St is general in nature. We provide commentary based on historical data and analyst forecasts only using an unbiased methodology and our articles are not intended to be financial advice. It does not constitute a recommendation to buy or sell any stock, and does not take account of your objectives, or your financial situation. We aim to bring you long-term focused analysis driven by fundamental data. Note that our analysis may not factor in the latest price-sensitive company announcements or qualitative material. Simply Wall St has no position in any stocks mentioned.
About SEHK:8069
Flydoo Technology Holding
An investment holding company, operates as a travel agent in Hong Kong and Macau.
Excellent balance sheet and slightly overvalued.
Market Insights

Advertisement
Community Narratives
Kodiak AI - a potential 100 bagger opportunity?
Fair Value US$14.00|41.9% undervalued
DA
Community Contributor
A Fair Price for a Great Business Facing Real Threats
Fair Value US$383.06|14.1% undervalued
IM
Community Contributor
AXON And Shopify Integration Will Unlock Global Mobile Advertising
Fair Value US$613.59|1.3% undervalued
AN
Based on Analyst Price Targets