- Hong Kong
- /
- Hospitality
- /
- SEHK:1901
Feiyang International Holdings Group (HKG:1901) May Have Issues Allocating Its Capital


If you're looking for a multi-bagger, there's a few things to keep an eye out for. Ideally, a business will show two trends; firstly a growing return on capital employed (ROCE) and secondly, an increasing amount of capital employed. If you see this, it typically means it's a company with a great business model and plenty of profitable reinvestment opportunities. Having said that, from a first glance at Feiyang International Holdings Group (HKG:1901) we aren't jumping out of our chairs at how returns are trending, but let's have a deeper look.
Understanding Return On Capital Employed (ROCE)
Just to clarify if you're unsure, ROCE is a metric for evaluating how much pre-tax income (in percentage terms) a company earns on the capital invested in its business. The formula for this calculation on Feiyang International Holdings Group is:
Return on Capital Employed = Earnings Before Interest and Tax (EBIT) ÷ (Total Assets - Current Liabilities)
0.017 = CN¥1.9m ÷ (CN¥375m - CN¥266m) (Based on the trailing twelve months to June 2022).
So, Feiyang International Holdings Group has an ROCE of 1.7%. In absolute terms, that's a low return and it also under-performs the Hospitality industry average of 2.9%.
Check out our latest analysis for Feiyang International Holdings Group
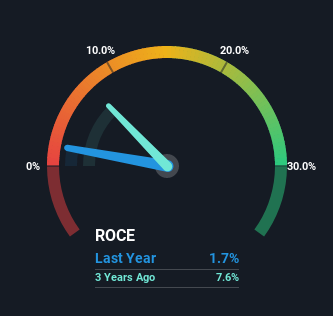
Historical performance is a great place to start when researching a stock so above you can see the gauge for Feiyang International Holdings Group's ROCE against it's prior returns. If you want to delve into the historical earnings, revenue and cash flow of Feiyang International Holdings Group, check out these free graphs here.
What Can We Tell From Feiyang International Holdings Group's ROCE Trend?
When we looked at the ROCE trend at Feiyang International Holdings Group, we didn't gain much confidence. Over the last five years, returns on capital have decreased to 1.7% from 53% five years ago. Given the business is employing more capital while revenue has slipped, this is a bit concerning. If this were to continue, you might be looking at a company that is trying to reinvest for growth but is actually losing market share since sales haven't increased.
On a side note, Feiyang International Holdings Group's current liabilities are still rather high at 71% of total assets. This can bring about some risks because the company is basically operating with a rather large reliance on its suppliers or other sorts of short-term creditors. While it's not necessarily a bad thing, it can be beneficial if this ratio is lower.
The Bottom Line
We're a bit apprehensive about Feiyang International Holdings Group because despite more capital being deployed in the business, returns on that capital and sales have both fallen. Long term shareholders who've owned the stock over the last three years have experienced a 19% depreciation in their investment, so it appears the market might not like these trends either. That being the case, unless the underlying trends revert to a more positive trajectory, we'd consider looking elsewhere.
One final note, you should learn about the 5 warning signs we've spotted with Feiyang International Holdings Group (including 3 which are a bit concerning) .
While Feiyang International Holdings Group may not currently earn the highest returns, we've compiled a list of companies that currently earn more than 25% return on equity. Check out this free list here.
New: AI Stock Screener & Alerts
Our new AI Stock Screener scans the market every day to uncover opportunities.
• Dividend Powerhouses (3%+ Yield)
• Undervalued Small Caps with Insider Buying
• High growth Tech and AI Companies
Or build your own from over 50 metrics.
Have feedback on this article? Concerned about the content? Get in touch with us directly. Alternatively, email editorial-team (at) simplywallst.com.
This article by Simply Wall St is general in nature. We provide commentary based on historical data and analyst forecasts only using an unbiased methodology and our articles are not intended to be financial advice. It does not constitute a recommendation to buy or sell any stock, and does not take account of your objectives, or your financial situation. We aim to bring you long-term focused analysis driven by fundamental data. Note that our analysis may not factor in the latest price-sensitive company announcements or qualitative material. Simply Wall St has no position in any stocks mentioned.
About SEHK:1901
Feiyang International Holdings Group
An investment holding company, engages in the design, development, and sale of travel related products and services in the People’s Republic of China.
Good value with worrying balance sheet.
Market Insights

Community Narratives

