- Hong Kong
- /
- Consumer Services
- /
- SEHK:1765
Slammed 27% XJ International Holdings Co., Ltd. (HKG:1765) Screens Well Here But There Might Be A Catch


Unfortunately for some shareholders, the XJ International Holdings Co., Ltd. (HKG:1765) share price has dived 27% in the last thirty days, prolonging recent pain. For any long-term shareholders, the last month ends a year to forget by locking in a 60% share price decline.
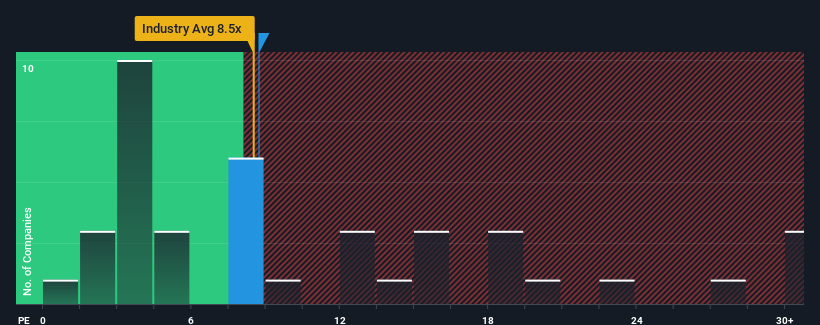
Although its price has dipped substantially, there still wouldn't be many who think XJ International Holdings' price-to-earnings (or "P/E") ratio of 8.7x is worth a mention when the median P/E in Hong Kong is similar at about 9x. Although, it's not wise to simply ignore the P/E without explanation as investors may be disregarding a distinct opportunity or a costly mistake.
With earnings that are retreating more than the market's of late, XJ International Holdings has been very sluggish. It might be that many expect the dismal earnings performance to revert back to market averages soon, which has kept the P/E from falling. If you still like the company, you'd want its earnings trajectory to turn around before making any decisions. Or at the very least, you'd be hoping it doesn't keep underperforming if your plan is to pick up some stock while it's not in favour.
View our latest analysis for XJ International Holdings
How Is XJ International Holdings' Growth Trending?
There's an inherent assumption that a company should be matching the market for P/E ratios like XJ International Holdings' to be considered reasonable.
Retrospectively, the last year delivered a frustrating 53% decrease to the company's bottom line. This means it has also seen a slide in earnings over the longer-term as EPS is down 3.8% in total over the last three years. Accordingly, shareholders would have felt downbeat about the medium-term rates of earnings growth.
Looking ahead now, EPS is anticipated to climb by 79% per year during the coming three years according to the four analysts following the company. That's shaping up to be materially higher than the 15% per year growth forecast for the broader market.
With this information, we find it interesting that XJ International Holdings is trading at a fairly similar P/E to the market. It may be that most investors aren't convinced the company can achieve future growth expectations.
The Key Takeaway
Following XJ International Holdings' share price tumble, its P/E is now hanging on to the median market P/E. We'd say the price-to-earnings ratio's power isn't primarily as a valuation instrument but rather to gauge current investor sentiment and future expectations.
We've established that XJ International Holdings currently trades on a lower than expected P/E since its forecast growth is higher than the wider market. There could be some unobserved threats to earnings preventing the P/E ratio from matching the positive outlook. It appears some are indeed anticipating earnings instability, because these conditions should normally provide a boost to the share price.
There are also other vital risk factors to consider before investing and we've discovered 3 warning signs for XJ International Holdings that you should be aware of.
If P/E ratios interest you, you may wish to see this free collection of other companies with strong earnings growth and low P/E ratios.
If you're looking to trade XJ International Holdings, open an account with the lowest-cost platform trusted by professionals, Interactive Brokers.
With clients in over 200 countries and territories, and access to 160 markets, IBKR lets you trade stocks, options, futures, forex, bonds and funds from a single integrated account.
Enjoy no hidden fees, no account minimums, and FX conversion rates as low as 0.03%, far better than what most brokers offer.
Sponsored ContentNew: AI Stock Screener & Alerts
Our new AI Stock Screener scans the market every day to uncover opportunities.
• Dividend Powerhouses (3%+ Yield)
• Undervalued Small Caps with Insider Buying
• High growth Tech and AI Companies
Or build your own from over 50 metrics.
Have feedback on this article? Concerned about the content? Get in touch with us directly. Alternatively, email editorial-team (at) simplywallst.com.
This article by Simply Wall St is general in nature. We provide commentary based on historical data and analyst forecasts only using an unbiased methodology and our articles are not intended to be financial advice. It does not constitute a recommendation to buy or sell any stock, and does not take account of your objectives, or your financial situation. We aim to bring you long-term focused analysis driven by fundamental data. Note that our analysis may not factor in the latest price-sensitive company announcements or qualitative material. Simply Wall St has no position in any stocks mentioned.
About SEHK:1765
XJ International Holdings
An investment holding company, engages in the provision of higher education and secondary vocational education services in China and Malaysia.
Good value with proven track record.
Market Insights

Community Narratives

