- Hong Kong
- /
- Consumer Services
- /
- SEHK:1765
Revenues Working Against XJ International Holdings Co., Ltd.'s (HKG:1765) Share Price Following 26% Dive

XJ International Holdings Co., Ltd. (HKG:1765) shareholders won't be pleased to see that the share price has had a very rough month, dropping 26% and undoing the prior period's positive performance. For any long-term shareholders, the last month ends a year to forget by locking in a 66% share price decline.
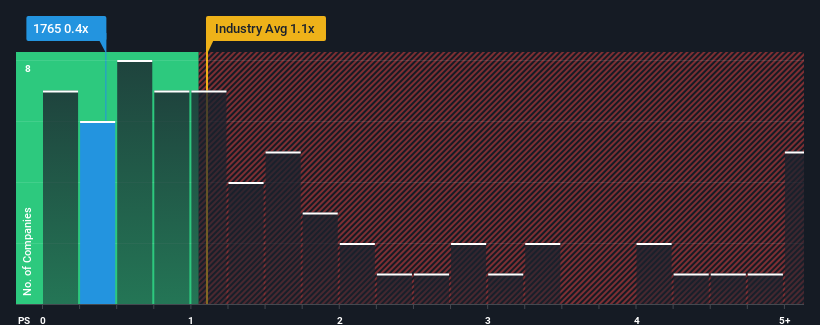
Although its price has dipped substantially, considering around half the companies operating in Hong Kong's Consumer Services industry have price-to-sales ratios (or "P/S") above 1.1x, you may still consider XJ International Holdings as an solid investment opportunity with its 0.4x P/S ratio. Although, it's not wise to just take the P/S at face value as there may be an explanation why it's limited.
View our latest analysis for XJ International Holdings

How Has XJ International Holdings Performed Recently?
While the industry has experienced revenue growth lately, XJ International Holdings' revenue has gone into reverse gear, which is not great. The P/S ratio is probably low because investors think this poor revenue performance isn't going to get any better. If this is the case, then existing shareholders will probably struggle to get excited about the future direction of the share price.
If you'd like to see what analysts are forecasting going forward, you should check out our free report on XJ International Holdings.What Are Revenue Growth Metrics Telling Us About The Low P/S?
There's an inherent assumption that a company should underperform the industry for P/S ratios like XJ International Holdings' to be considered reasonable.
In reviewing the last year of financials, we were disheartened to see the company's revenues fell to the tune of 17%. However, a few very strong years before that means that it was still able to grow revenue by an impressive 128% in total over the last three years. So we can start by confirming that the company has generally done a very good job of growing revenue over that time, even though it had some hiccups along the way.
Looking ahead now, revenue is anticipated to climb by 12% during the coming year according to the four analysts following the company. With the industry predicted to deliver 18% growth, the company is positioned for a weaker revenue result.
With this information, we can see why XJ International Holdings is trading at a P/S lower than the industry. It seems most investors are expecting to see limited future growth and are only willing to pay a reduced amount for the stock.
The Final Word
XJ International Holdings' P/S has taken a dip along with its share price. It's argued the price-to-sales ratio is an inferior measure of value within certain industries, but it can be a powerful business sentiment indicator.
We've established that XJ International Holdings maintains its low P/S on the weakness of its forecast growth being lower than the wider industry, as expected. At this stage investors feel the potential for an improvement in revenue isn't great enough to justify a higher P/S ratio. The company will need a change of fortune to justify the P/S rising higher in the future.
Don't forget that there may be other risks. For instance, we've identified 3 warning signs for XJ International Holdings (1 doesn't sit too well with us) you should be aware of.
Of course, profitable companies with a history of great earnings growth are generally safer bets. So you may wish to see this free collection of other companies that have reasonable P/E ratios and have grown earnings strongly.
New: AI Stock Screener & Alerts
Our new AI Stock Screener scans the market every day to uncover opportunities.
• Dividend Powerhouses (3%+ Yield)
• Undervalued Small Caps with Insider Buying
• High growth Tech and AI Companies
Or build your own from over 50 metrics.
Have feedback on this article? Concerned about the content? Get in touch with us directly. Alternatively, email editorial-team (at) simplywallst.com.
This article by Simply Wall St is general in nature. We provide commentary based on historical data and analyst forecasts only using an unbiased methodology and our articles are not intended to be financial advice. It does not constitute a recommendation to buy or sell any stock, and does not take account of your objectives, or your financial situation. We aim to bring you long-term focused analysis driven by fundamental data. Note that our analysis may not factor in the latest price-sensitive company announcements or qualitative material. Simply Wall St has no position in any stocks mentioned.
Have feedback on this article? Concerned about the content? Get in touch with us directly. Alternatively, email editorial-team@simplywallst.com
About SEHK:1765
XJ International Holdings
An investment holding company, engages in the provision of higher education and secondary vocational education services in China and Malaysia.
Good value with proven track record.
Market Insights
Community Narratives


