
Advertisement
- Hong Kong
- /
- Consumer Services
- /
- SEHK:1765
Returns On Capital Signal Tricky Times Ahead For Hope Education Group (HKG:1765)

If you're not sure where to start when looking for the next multi-bagger, there are a few key trends you should keep an eye out for. One common approach is to try and find a company with returns on capital employed (ROCE) that are increasing, in conjunction with a growing amount of capital employed. Basically this means that a company has profitable initiatives that it can continue to reinvest in, which is a trait of a compounding machine. In light of that, when we looked at Hope Education Group (HKG:1765) and its ROCE trend, we weren't exactly thrilled.
What is Return On Capital Employed (ROCE)?
For those that aren't sure what ROCE is, it measures the amount of pre-tax profits a company can generate from the capital employed in its business. Analysts use this formula to calculate it for Hope Education Group:
Return on Capital Employed = Earnings Before Interest and Tax (EBIT) ÷ (Total Assets - Current Liabilities)
0.04 = CN¥434m ÷ (CN¥15b - CN¥4.3b) (Based on the trailing twelve months to February 2021).
Thus, Hope Education Group has an ROCE of 4.0%. Ultimately, that's a low return and it under-performs the Consumer Services industry average of 7.9%.
View our latest analysis for Hope Education Group
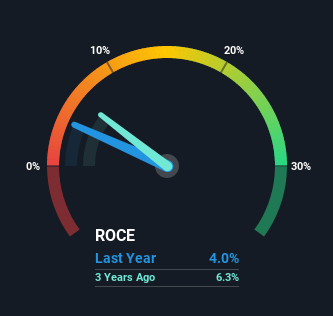
Above you can see how the current ROCE for Hope Education Group compares to its prior returns on capital, but there's only so much you can tell from the past. If you're interested, you can view the analysts predictions in our free report on analyst forecasts for the company.
The Trend Of ROCE
We weren't thrilled with the trend because Hope Education Group's ROCE has reduced by 56% over the last five years, while the business employed 503% more capital. However, some of the increase in capital employed could be attributed to the recent capital raising that's been completed prior to their latest reporting period, so keep that in mind when looking at the ROCE decrease. Hope Education Group probably hasn't received a full year of earnings yet from the new funds it raised, so these figures should be taken with a grain of salt. Additionally, we found that Hope Education Group's most recent EBIT figure is around the same as the prior year, so we'd attribute the drop in ROCE mostly to the capital raise.
On a side note, Hope Education Group has done well to pay down its current liabilities to 28% of total assets. That could partly explain why the ROCE has dropped. What's more, this can reduce some aspects of risk to the business because now the company's suppliers or short-term creditors are funding less of its operations. Some would claim this reduces the business' efficiency at generating ROCE since it is now funding more of the operations with its own money.
In Conclusion...
Even though returns on capital have fallen in the short term, we find it promising that revenue and capital employed have both increased for Hope Education Group. However, total returns to shareholders over the last year have been flat, which could indicate these growth trends potentially aren't accounted for yet by investors. As a result, we'd recommend researching this stock further to uncover what other fundamentals of the business can show us.
One more thing, we've spotted 5 warning signs facing Hope Education Group that you might find interesting.
While Hope Education Group may not currently earn the highest returns, we've compiled a list of companies that currently earn more than 25% return on equity. Check out this free list here.
If you’re looking to trade a wide range of investments, open an account with the lowest-cost* platform trusted by professionals, Interactive Brokers. Their clients from over 200 countries and territories trade stocks, options, futures, forex, bonds and funds worldwide from a single integrated account. Promoted
New: AI Stock Screener & Alerts
Our new AI Stock Screener scans the market every day to uncover opportunities.
• Dividend Powerhouses (3%+ Yield)
• Undervalued Small Caps with Insider Buying
• High growth Tech and AI Companies
Or build your own from over 50 metrics.
This article by Simply Wall St is general in nature. It does not constitute a recommendation to buy or sell any stock, and does not take account of your objectives, or your financial situation. We aim to bring you long-term focused analysis driven by fundamental data. Note that our analysis may not factor in the latest price-sensitive company announcements or qualitative material. Simply Wall St has no position in any stocks mentioned.
*Interactive Brokers Rated Lowest Cost Broker by StockBrokers.com Annual Online Review 2020
Have feedback on this article? Concerned about the content? Get in touch with us directly. Alternatively, email editorial-team (at) simplywallst.com.
About SEHK:1765
XJ International Holdings
An investment holding company, engages in the provision of higher education and secondary vocational education services in China and Malaysia.
Good value with proven track record.
Market Insights

Advertisement
Community Narratives
Groundbreaking therapies that could change the treatment landscape for PTSD, fibromyalgia, MS & Alzheimer’s
Fair Value US$6.20|86.9% undervalued
CM
Community Contributor
DigitalOcean Will Grow 14% by Embracing AI with Paperspace Acquisition
Fair Value US$50.00|42.8% undervalued
NE
Community Contributor
Viant Technology: A Rising AdTech Challenger in the AI-Powered CTV Market
Fair Value US$38.61|66.0% undervalued
BL
Community Contributor
Volvo will Accelerate Forward into Electric and Autonomous Leadership in Five Years
Fair Value SEK 438.80|40.8% undervalued
UN
Community Contributor