
Advertisement
- Hong Kong
- /
- Food and Staples Retail
- /
- SEHK:314
Positive Sentiment Still Eludes Sipai Health Technology Co., Ltd. (HKG:314) Following 26% Share Price Slump
To the annoyance of some shareholders, Sipai Health Technology Co., Ltd. (HKG:314) shares are down a considerable 26% in the last month, which continues a horrid run for the company. The drop over the last 30 days has capped off a tough year for shareholders, with the share price down 49% in that time.
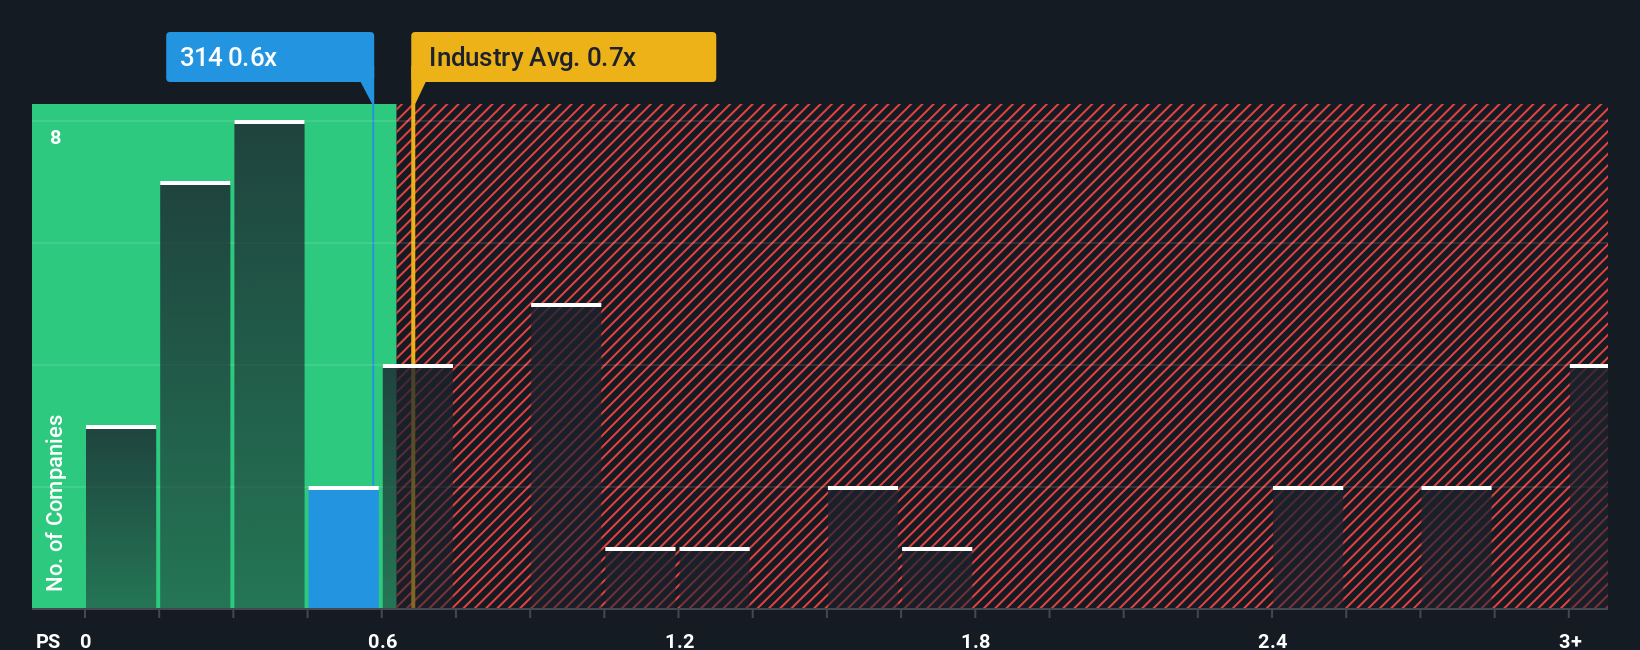
In spite of the heavy fall in price, you could still be forgiven for feeling indifferent about Sipai Health Technology's P/S ratio of 0.6x, since the median price-to-sales (or "P/S") ratio for the Consumer Retailing industry in Hong Kong is also close to 0.7x. Although, it's not wise to simply ignore the P/S without explanation as investors may be disregarding a distinct opportunity or a costly mistake.
View our latest analysis for Sipai Health Technology
What Does Sipai Health Technology's Recent Performance Look Like?
While the industry has experienced revenue growth lately, Sipai Health Technology's revenue has gone into reverse gear, which is not great. Perhaps the market is expecting its poor revenue performance to improve, keeping the P/S from dropping. You'd really hope so, otherwise you're paying a relatively elevated price for a company with this sort of growth profile.
Keen to find out how analysts think Sipai Health Technology's future stacks up against the industry? In that case, our free report is a great place to start.How Is Sipai Health Technology's Revenue Growth Trending?
There's an inherent assumption that a company should be matching the industry for P/S ratios like Sipai Health Technology's to be considered reasonable.
Retrospectively, the last year delivered a frustrating 26% decrease to the company's top line. This means it has also seen a slide in revenue over the longer-term as revenue is down 10% in total over the last three years. Accordingly, shareholders would have felt downbeat about the medium-term rates of revenue growth.
Looking ahead now, revenue is anticipated to climb by 49% during the coming year according to the sole analyst following the company. Meanwhile, the rest of the industry is forecast to only expand by 15%, which is noticeably less attractive.
With this information, we find it interesting that Sipai Health Technology is trading at a fairly similar P/S compared to the industry. It may be that most investors aren't convinced the company can achieve future growth expectations.
What Does Sipai Health Technology's P/S Mean For Investors?
With its share price dropping off a cliff, the P/S for Sipai Health Technology looks to be in line with the rest of the Consumer Retailing industry. Using the price-to-sales ratio alone to determine if you should sell your stock isn't sensible, however it can be a practical guide to the company's future prospects.
We've established that Sipai Health Technology currently trades on a lower than expected P/S since its forecasted revenue growth is higher than the wider industry. When we see a strong revenue outlook, with growth outpacing the industry, we can only assume potential uncertainty around these figures are what might be placing slight pressure on the P/S ratio. It appears some are indeed anticipating revenue instability, because these conditions should normally provide a boost to the share price.
We don't want to rain on the parade too much, but we did also find 1 warning sign for Sipai Health Technology that you need to be mindful of.
It's important to make sure you look for a great company, not just the first idea you come across. So if growing profitability aligns with your idea of a great company, take a peek at this free list of interesting companies with strong recent earnings growth (and a low P/E).
New: Manage All Your Stock Portfolios in One Place
We've created the ultimate portfolio companion for stock investors, and it's free.
• Connect an unlimited number of Portfolios and see your total in one currency
• Be alerted to new Warning Signs or Risks via email or mobile
• Track the Fair Value of your stocks
Have feedback on this article? Concerned about the content? Get in touch with us directly. Alternatively, email editorial-team (at) simplywallst.com.
This article by Simply Wall St is general in nature. We provide commentary based on historical data and analyst forecasts only using an unbiased methodology and our articles are not intended to be financial advice. It does not constitute a recommendation to buy or sell any stock, and does not take account of your objectives, or your financial situation. We aim to bring you long-term focused analysis driven by fundamental data. Note that our analysis may not factor in the latest price-sensitive company announcements or qualitative material. Simply Wall St has no position in any stocks mentioned.
About SEHK:314
Sipai Health Technology
Operates as a medical technology and health management company in the People’s Republic of China.
Excellent balance sheet and fair value.
Market Insights

Advertisement
Weekly Picks
RO


RockeTeller on Santacruz Silver Mining ·
Crazy Undervalued 42 Baggers Silver Play (Active & Running Mine)
Fair Value:CA$8696.4% undervalued
41 followersusers have followed this narrative
6 commentsusers have commented on this narrative
13 likesusers have liked this narrative
RO


Robbo on Fiducian Group ·
Fiducian: Compliance Clouds or Value Opportunity?
Fair Value:AU$123.8% undervalued
5 followersusers have followed this narrative
0 commentsusers have commented on this narrative
0 likesusers have liked this narrative
WO

woodworthfund on Willamette Valley Vineyards ·
Willamette Valley Vineyards (WVVI): Not-So-Great Value
Fair Value:US$244.5% overvalued
7 followersusers have followed this narrative
0 commentsusers have commented on this narrative
1 likeusers have liked this narrative
Recently Updated Narratives
SC

scm on Text ·
TXT will see revenue grow 26% with a profit margin boost of almost 40%
Fair Value:zł8048.3% undervalued
2 followersusers have followed this narrative
0 commentsusers have commented on this narrative
0 likesusers have liked this narrative
VL

Vladislav on Galleon Gold ·
Significantly undervalued gold explorer in Timmins, finally getting traction
Fair Value:CA$482.9% undervalued
2 followersusers have followed this narrative
0 commentsusers have commented on this narrative
0 likesusers have liked this narrative
FU

FundamentallySarcastic on Credit Corp Group ·
Moderation and Stabilisation: HOLD: Fair Price based on a 4-year Cycle is $12.08
Fair Value:AU$12.6411.8% overvalued
3 followersusers have followed this narrative
0 commentsusers have commented on this narrative
0 likesusers have liked this narrative
Popular Narratives
TH


TheWallstreetKing on MicroVision ·
MicroVision will explode future revenue by 380.37% with a vision towards success
Fair Value:US$6098.5% undervalued
116 followersusers have followed this narrative
11 commentsusers have commented on this narrative
22 likesusers have liked this narrative
AN


AnalystConsensusTarget on NVIDIA ·
NVDA: Expanding AI Demand Will Drive Major Data Center Investments Through 2026
Fair Value:US$250.3928.3% undervalued
955 followersusers have followed this narrative
6 commentsusers have commented on this narrative
25 likesusers have liked this narrative
OS


oscargarcia on Alphabet ·
The company that turned a verb into a global necessity and basically runs the modern internet, digital ads, smartphones, maps, and AI.
Fair Value:US$3406.0% undervalued
147 followersusers have followed this narrative
6 commentsusers have commented on this narrative
18 likesusers have liked this narrative

