- Hong Kong
- /
- Food and Staples Retail
- /
- SEHK:30
YNBY International Limited's (HKG:30) Popularity With Investors Under Threat As Stock Sinks 32%


The YNBY International Limited (HKG:30) share price has fared very poorly over the last month, falling by a substantial 32%. To make matters worse, the recent drop has wiped out a year's worth of gains with the share price now back where it started a year ago.
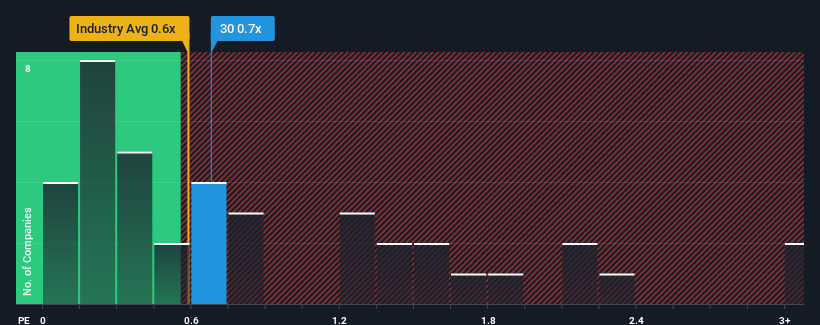
In spite of the heavy fall in price, it's still not a stretch to say that YNBY International's price-to-sales (or "P/S") ratio of 0.7x right now seems quite "middle-of-the-road" compared to the Consumer Retailing industry in Hong Kong, where the median P/S ratio is around 0.6x. While this might not raise any eyebrows, if the P/S ratio is not justified investors could be missing out on a potential opportunity or ignoring looming disappointment.
See our latest analysis for YNBY International
How Has YNBY International Performed Recently?
With revenue growth that's exceedingly strong of late, YNBY International has been doing very well. The P/S is probably moderate because investors think this strong revenue growth might not be enough to outperform the broader industry in the near future. If that doesn't eventuate, then existing shareholders have reason to be feeling optimistic about the future direction of the share price.
We don't have analyst forecasts, but you can see how recent trends are setting up the company for the future by checking out our free report on YNBY International's earnings, revenue and cash flow.Is There Some Revenue Growth Forecasted For YNBY International?
YNBY International's P/S ratio would be typical for a company that's only expected to deliver moderate growth, and importantly, perform in line with the industry.
Taking a look back first, we see that the company's revenues underwent some rampant growth over the last 12 months. However, this wasn't enough as the latest three year period has seen the company endure a nasty 32% drop in revenue in aggregate. So unfortunately, we have to acknowledge that the company has not done a great job of growing revenues over that time.
Weighing that medium-term revenue trajectory against the broader industry's one-year forecast for expansion of 11% shows it's an unpleasant look.
With this in mind, we find it worrying that YNBY International's P/S exceeds that of its industry peers. It seems most investors are ignoring the recent poor growth rate and are hoping for a turnaround in the company's business prospects. There's a good chance existing shareholders are setting themselves up for future disappointment if the P/S falls to levels more in line with the recent negative growth rates.
What Does YNBY International's P/S Mean For Investors?
YNBY International's plummeting stock price has brought its P/S back to a similar region as the rest of the industry. Using the price-to-sales ratio alone to determine if you should sell your stock isn't sensible, however it can be a practical guide to the company's future prospects.
We find it unexpected that YNBY International trades at a P/S ratio that is comparable to the rest of the industry, despite experiencing declining revenues during the medium-term, while the industry as a whole is expected to grow. Even though it matches the industry, we're uncomfortable with the current P/S ratio, as this dismal revenue performance is unlikely to support a more positive sentiment for long. If recent medium-term revenue trends continue, it will place shareholders' investments at risk and potential investors in danger of paying an unnecessary premium.
Before you take the next step, you should know about the 3 warning signs for YNBY International that we have uncovered.
It's important to make sure you look for a great company, not just the first idea you come across. So if growing profitability aligns with your idea of a great company, take a peek at this free list of interesting companies with strong recent earnings growth (and a low P/E).
If you're looking to trade YNBY International, open an account with the lowest-cost platform trusted by professionals, Interactive Brokers.
With clients in over 200 countries and territories, and access to 160 markets, IBKR lets you trade stocks, options, futures, forex, bonds and funds from a single integrated account.
Enjoy no hidden fees, no account minimums, and FX conversion rates as low as 0.03%, far better than what most brokers offer.
Sponsored ContentNew: Manage All Your Stock Portfolios in One Place
We've created the ultimate portfolio companion for stock investors, and it's free.
• Connect an unlimited number of Portfolios and see your total in one currency
• Be alerted to new Warning Signs or Risks via email or mobile
• Track the Fair Value of your stocks
Have feedback on this article? Concerned about the content? Get in touch with us directly. Alternatively, email editorial-team (at) simplywallst.com.
This article by Simply Wall St is general in nature. We provide commentary based on historical data and analyst forecasts only using an unbiased methodology and our articles are not intended to be financial advice. It does not constitute a recommendation to buy or sell any stock, and does not take account of your objectives, or your financial situation. We aim to bring you long-term focused analysis driven by fundamental data. Note that our analysis may not factor in the latest price-sensitive company announcements or qualitative material. Simply Wall St has no position in any stocks mentioned.
About SEHK:30
YNBY International
An investment holding company, engages in the e-commerce trading business in Hong Kong, the People’s Republic of China, and internationally.
Flawless balance sheet and slightly overvalued.
Market Insights

Community Narratives

