
Advertisement
- Hong Kong
- /
- Consumer Durables
- /
- SEHK:751
Skyworth Group's (HKG:751) five-year earnings growth trails the 9.7% YoY shareholder returns

Stock pickers are generally looking for stocks that will outperform the broader market. And in our experience, buying the right stocks can give your wealth a significant boost. To wit, the Skyworth Group share price has climbed 44% in five years, easily topping the market decline of 3.7% (ignoring dividends). However, more recent returns haven't been as impressive as that, with the stock returning just 17% in the last year, including dividends.
The past week has proven to be lucrative for Skyworth Group investors, so let's see if fundamentals drove the company's five-year performance.
See our latest analysis for Skyworth Group
In his essay The Superinvestors of Graham-and-Doddsville Warren Buffett described how share prices do not always rationally reflect the value of a business. One imperfect but simple way to consider how the market perception of a company has shifted is to compare the change in the earnings per share (EPS) with the share price movement.
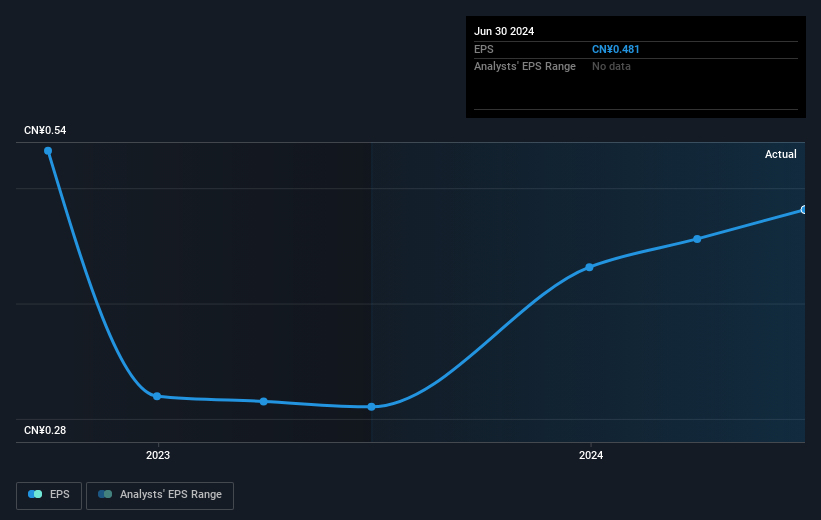
During five years of share price growth, Skyworth Group achieved compound earnings per share (EPS) growth of 16% per year. The EPS growth is more impressive than the yearly share price gain of 8% over the same period. So it seems the market isn't so enthusiastic about the stock these days. This cautious sentiment is reflected in its (fairly low) P/E ratio of 5.34.
The graphic below depicts how EPS has changed over time (unveil the exact values by clicking on the image).
We consider it positive that insiders have made significant purchases in the last year. Having said that, most people consider earnings and revenue growth trends to be a more meaningful guide to the business. Dive deeper into the earnings by checking this interactive graph of Skyworth Group's earnings, revenue and cash flow.
What About The Total Shareholder Return (TSR)?
We've already covered Skyworth Group's share price action, but we should also mention its total shareholder return (TSR). The TSR is a return calculation that accounts for the value of cash dividends (assuming that any dividend received was reinvested) and the calculated value of any discounted capital raisings and spin-offs. Dividends have been really beneficial for Skyworth Group shareholders, and that cash payout contributed to why its TSR of 59%, over the last 5 years, is better than the share price return.
A Different Perspective
Skyworth Group shareholders gained a total return of 17% during the year. Unfortunately this falls short of the market return. The silver lining is that the gain was actually better than the average annual return of 10% per year over five year. This suggests the company might be improving over time. It's always interesting to track share price performance over the longer term. But to understand Skyworth Group better, we need to consider many other factors. For instance, we've identified 2 warning signs for Skyworth Group that you should be aware of.
Skyworth Group is not the only stock insiders are buying. So take a peek at this free list of small cap companies at attractive valuations which insiders have been buying.
Please note, the market returns quoted in this article reflect the market weighted average returns of stocks that currently trade on Hong Kong exchanges.
New: Manage All Your Stock Portfolios in One Place
We've created the ultimate portfolio companion for stock investors, and it's free.
• Connect an unlimited number of Portfolios and see your total in one currency
• Be alerted to new Warning Signs or Risks via email or mobile
• Track the Fair Value of your stocks
Have feedback on this article? Concerned about the content? Get in touch with us directly. Alternatively, email editorial-team (at) simplywallst.com.
This article by Simply Wall St is general in nature. We provide commentary based on historical data and analyst forecasts only using an unbiased methodology and our articles are not intended to be financial advice. It does not constitute a recommendation to buy or sell any stock, and does not take account of your objectives, or your financial situation. We aim to bring you long-term focused analysis driven by fundamental data. Note that our analysis may not factor in the latest price-sensitive company announcements or qualitative material. Simply Wall St has no position in any stocks mentioned.
About SEHK:751
Skyworth Group
An investment holding company, researches and develops, manufactures, sells, trades, and exports consumer electronic products worldwide.
Adequate balance sheet with moderate growth potential.
Similar Companies
Market Insights


Advertisement
Community Narratives
The Future of Drug Testing? Fingerprint Tech Shows Serious Promise
Fair Value US$2.98|43.0% undervalued
JO
Community Contributor
Suncorp’s Next Chapter: Insurance-Only and Ready to Grow
Fair Value AU$22.83|7.6% undervalued
RO
Community Contributor
Thyssenkrupp Nucera Will Achieve Double-Digit Profits by 2030 Boosted by Hydrogen Growth
Fair Value €14.40|30.6% undervalued
CH
Community Contributor
Tesla’s Nvidia Moment – The AI & Robotics Inflection Point
Fair Value US$359.72|18.3% undervalued
BL
Community Contributor