Risks Still Elevated At These Prices As Continental Holdings Limited (HKG:513) Shares Dive 32%


Continental Holdings Limited (HKG:513) shares have had a horrible month, losing 32% after a relatively good period beforehand. The drop over the last 30 days has capped off a tough year for shareholders, with the share price down 45% in that time.
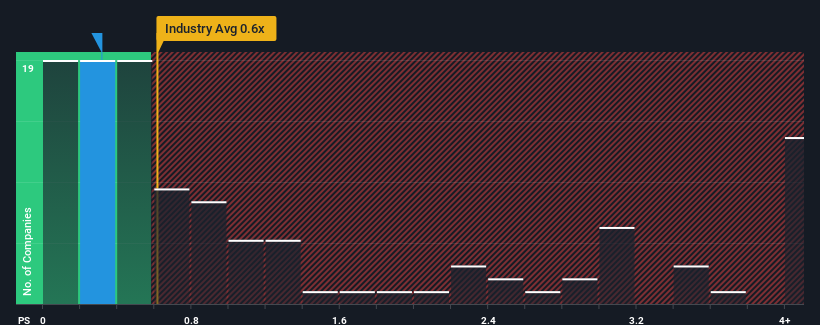
Even after such a large drop in price, there still wouldn't be many who think Continental Holdings' price-to-sales (or "P/S") ratio of 0.3x is worth a mention when the median P/S in Hong Kong's Luxury industry is similar at about 0.6x. While this might not raise any eyebrows, if the P/S ratio is not justified investors could be missing out on a potential opportunity or ignoring looming disappointment.
Check out our latest analysis for Continental Holdings
What Does Continental Holdings' Recent Performance Look Like?
For instance, Continental Holdings' receding revenue in recent times would have to be some food for thought. It might be that many expect the company to put the disappointing revenue performance behind them over the coming period, which has kept the P/S from falling. If you like the company, you'd at least be hoping this is the case so that you could potentially pick up some stock while it's not quite in favour.
Although there are no analyst estimates available for Continental Holdings, take a look at this free data-rich visualisation to see how the company stacks up on earnings, revenue and cash flow.How Is Continental Holdings' Revenue Growth Trending?
In order to justify its P/S ratio, Continental Holdings would need to produce growth that's similar to the industry.
Retrospectively, the last year delivered a frustrating 25% decrease to the company's top line. This has soured the latest three-year period, which nevertheless managed to deliver a decent 8.4% overall rise in revenue. Although it's been a bumpy ride, it's still fair to say the revenue growth recently has been mostly respectable for the company.
Comparing that to the industry, which is predicted to deliver 12% growth in the next 12 months, the company's momentum is weaker, based on recent medium-term annualised revenue results.
With this information, we find it interesting that Continental Holdings is trading at a fairly similar P/S compared to the industry. It seems most investors are ignoring the fairly limited recent growth rates and are willing to pay up for exposure to the stock. They may be setting themselves up for future disappointment if the P/S falls to levels more in line with recent growth rates.
What Does Continental Holdings' P/S Mean For Investors?
Following Continental Holdings' share price tumble, its P/S is just clinging on to the industry median P/S. While the price-to-sales ratio shouldn't be the defining factor in whether you buy a stock or not, it's quite a capable barometer of revenue expectations.
Our examination of Continental Holdings revealed its poor three-year revenue trends aren't resulting in a lower P/S as per our expectations, given they look worse than current industry outlook. When we see weak revenue with slower than industry growth, we suspect the share price is at risk of declining, bringing the P/S back in line with expectations. Unless the recent medium-term conditions improve, it's hard to accept the current share price as fair value.
There are also other vital risk factors to consider and we've discovered 4 warning signs for Continental Holdings (3 shouldn't be ignored!) that you should be aware of before investing here.
If you're unsure about the strength of Continental Holdings' business, why not explore our interactive list of stocks with solid business fundamentals for some other companies you may have missed.
If you're looking to trade Continental Holdings, open an account with the lowest-cost platform trusted by professionals, Interactive Brokers.
With clients in over 200 countries and territories, and access to 160 markets, IBKR lets you trade stocks, options, futures, forex, bonds and funds from a single integrated account.
Enjoy no hidden fees, no account minimums, and FX conversion rates as low as 0.03%, far better than what most brokers offer.
Sponsored ContentNew: AI Stock Screener & Alerts
Our new AI Stock Screener scans the market every day to uncover opportunities.
• Dividend Powerhouses (3%+ Yield)
• Undervalued Small Caps with Insider Buying
• High growth Tech and AI Companies
Or build your own from over 50 metrics.
Have feedback on this article? Concerned about the content? Get in touch with us directly. Alternatively, email editorial-team (at) simplywallst.com.
This article by Simply Wall St is general in nature. We provide commentary based on historical data and analyst forecasts only using an unbiased methodology and our articles are not intended to be financial advice. It does not constitute a recommendation to buy or sell any stock, and does not take account of your objectives, or your financial situation. We aim to bring you long-term focused analysis driven by fundamental data. Note that our analysis may not factor in the latest price-sensitive company announcements or qualitative material. Simply Wall St has no position in any stocks mentioned.
About SEHK:513
Continental Holdings
An investment holding company, designs, manufactures, markets, wholesales, retails, and trades in fine jewelries and diamonds.
Good value low.
Market Insights

Community Narratives

