Revenues Tell The Story For China Anchu Energy Storage Group Limited (HKG:2399) As Its Stock Soars 34%

Despite an already strong run, China Anchu Energy Storage Group Limited (HKG:2399) shares have been powering on, with a gain of 34% in the last thirty days. The last 30 days bring the annual gain to a very sharp 39%.
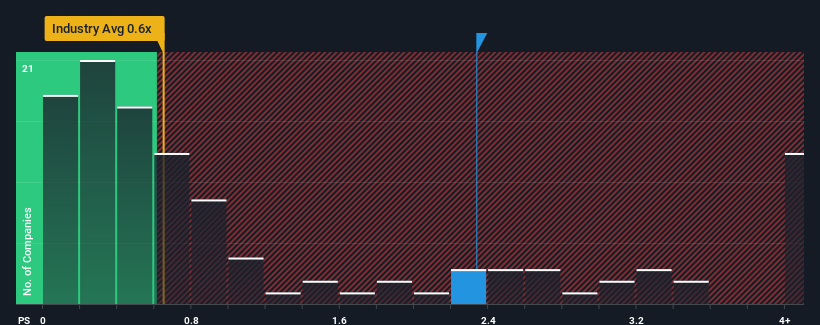
After such a large jump in price, when almost half of the companies in Hong Kong's Luxury industry have price-to-sales ratios (or "P/S") below 0.6x, you may consider China Anchu Energy Storage Group as a stock probably not worth researching with its 2.3x P/S ratio. Although, it's not wise to just take the P/S at face value as there may be an explanation why it's as high as it is.
View our latest analysis for China Anchu Energy Storage Group

How Has China Anchu Energy Storage Group Performed Recently?
The revenue growth achieved at China Anchu Energy Storage Group over the last year would be more than acceptable for most companies. One possibility is that the P/S ratio is high because investors think this respectable revenue growth will be enough to outperform the broader industry in the near future. However, if this isn't the case, investors might get caught out paying too much for the stock.
We don't have analyst forecasts, but you can see how recent trends are setting up the company for the future by checking out our free report on China Anchu Energy Storage Group's earnings, revenue and cash flow.Is There Enough Revenue Growth Forecasted For China Anchu Energy Storage Group?
China Anchu Energy Storage Group's P/S ratio would be typical for a company that's expected to deliver solid growth, and importantly, perform better than the industry.
Taking a look back first, we see that the company grew revenue by an impressive 21% last year. Pleasingly, revenue has also lifted 107% in aggregate from three years ago, thanks to the last 12 months of growth. So we can start by confirming that the company has done a great job of growing revenue over that time.
When compared to the industry's one-year growth forecast of 12%, the most recent medium-term revenue trajectory is noticeably more alluring
With this information, we can see why China Anchu Energy Storage Group is trading at such a high P/S compared to the industry. Presumably shareholders aren't keen to offload something they believe will continue to outmanoeuvre the wider industry.
What Does China Anchu Energy Storage Group's P/S Mean For Investors?
China Anchu Energy Storage Group shares have taken a big step in a northerly direction, but its P/S is elevated as a result. It's argued the price-to-sales ratio is an inferior measure of value within certain industries, but it can be a powerful business sentiment indicator.
As we suspected, our examination of China Anchu Energy Storage Group revealed its three-year revenue trends are contributing to its high P/S, given they look better than current industry expectations. At this stage investors feel the potential continued revenue growth in the future is great enough to warrant an inflated P/S. Barring any significant changes to the company's ability to make money, the share price should continue to be propped up.
Before you settle on your opinion, we've discovered 3 warning signs for China Anchu Energy Storage Group (2 make us uncomfortable!) that you should be aware of.
If these risks are making you reconsider your opinion on China Anchu Energy Storage Group, explore our interactive list of high quality stocks to get an idea of what else is out there.
If you're looking to trade China Anchu Energy Storage Group, open an account with the lowest-cost platform trusted by professionals, Interactive Brokers.
With clients in over 200 countries and territories, and access to 160 markets, IBKR lets you trade stocks, options, futures, forex, bonds and funds from a single integrated account.
Enjoy no hidden fees, no account minimums, and FX conversion rates as low as 0.03%, far better than what most brokers offer.
Sponsored ContentNew: AI Stock Screener & Alerts
Our new AI Stock Screener scans the market every day to uncover opportunities.
• Dividend Powerhouses (3%+ Yield)
• Undervalued Small Caps with Insider Buying
• High growth Tech and AI Companies
Or build your own from over 50 metrics.
Have feedback on this article? Concerned about the content? Get in touch with us directly. Alternatively, email editorial-team (at) simplywallst.com.
This article by Simply Wall St is general in nature. We provide commentary based on historical data and analyst forecasts only using an unbiased methodology and our articles are not intended to be financial advice. It does not constitute a recommendation to buy or sell any stock, and does not take account of your objectives, or your financial situation. We aim to bring you long-term focused analysis driven by fundamental data. Note that our analysis may not factor in the latest price-sensitive company announcements or qualitative material. Simply Wall St has no position in any stocks mentioned.
About SEHK:2399
China Anchu Energy Storage Group
Designs, an investment holding company, manufactures and wholesales a range of menswear products under the FORDOO brand in the People’s Republic of China, Saudi Arabia, and other Middle Eastern countries.
Overvalued with worrying balance sheet.
Market Insights
Community Narratives


