- Hong Kong
- /
- Consumer Durables
- /
- SEHK:2285
It's Down 25% But Chervon Holdings Limited (HKG:2285) Could Be Riskier Than It Looks
Chervon Holdings Limited (HKG:2285) shareholders won't be pleased to see that the share price has had a very rough month, dropping 25% and undoing the prior period's positive performance. The drop over the last 30 days has capped off a tough year for shareholders, with the share price down 19% in that time.
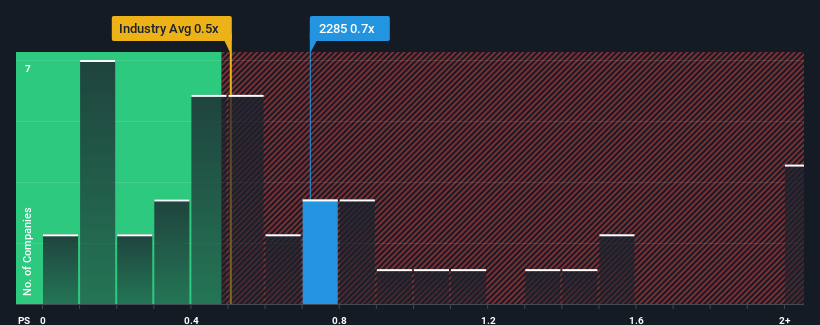
Although its price has dipped substantially, it's still not a stretch to say that Chervon Holdings' price-to-sales (or "P/S") ratio of 0.7x right now seems quite "middle-of-the-road" compared to the Consumer Durables industry in Hong Kong, where the median P/S ratio is around 0.5x. However, investors might be overlooking a clear opportunity or potential setback if there is no rational basis for the P/S.
See our latest analysis for Chervon Holdings

What Does Chervon Holdings' P/S Mean For Shareholders?
Chervon Holdings could be doing better as its revenue has been going backwards lately while most other companies have been seeing positive revenue growth. One possibility is that the P/S ratio is moderate because investors think this poor revenue performance will turn around. If not, then existing shareholders may be a little nervous about the viability of the share price.
If you'd like to see what analysts are forecasting going forward, you should check out our free report on Chervon Holdings.Is There Some Revenue Growth Forecasted For Chervon Holdings?
In order to justify its P/S ratio, Chervon Holdings would need to produce growth that's similar to the industry.
Retrospectively, the last year delivered a frustrating 16% decrease to the company's top line. The last three years don't look nice either as the company has shrunk revenue by 6.6% in aggregate. Therefore, it's fair to say the revenue growth recently has been undesirable for the company.
Turning to the outlook, the next year should generate growth of 26% as estimated by the nine analysts watching the company. With the industry only predicted to deliver 14%, the company is positioned for a stronger revenue result.
In light of this, it's curious that Chervon Holdings' P/S sits in line with the majority of other companies. Apparently some shareholders are skeptical of the forecasts and have been accepting lower selling prices.
What We Can Learn From Chervon Holdings' P/S?
Following Chervon Holdings' share price tumble, its P/S is just clinging on to the industry median P/S. Typically, we'd caution against reading too much into price-to-sales ratios when settling on investment decisions, though it can reveal plenty about what other market participants think about the company.
Looking at Chervon Holdings' analyst forecasts revealed that its superior revenue outlook isn't giving the boost to its P/S that we would've expected. Perhaps uncertainty in the revenue forecasts are what's keeping the P/S ratio consistent with the rest of the industry. However, if you agree with the analysts' forecasts, you may be able to pick up the stock at an attractive price.
A lot of potential risks can sit within a company's balance sheet. You can assess many of the main risks through our free balance sheet analysis for Chervon Holdings with six simple checks.
It's important to make sure you look for a great company, not just the first idea you come across. So if growing profitability aligns with your idea of a great company, take a peek at this free list of interesting companies with strong recent earnings growth (and a low P/E).
New: AI Stock Screener & Alerts
Our new AI Stock Screener scans the market every day to uncover opportunities.
• Dividend Powerhouses (3%+ Yield)
• Undervalued Small Caps with Insider Buying
• High growth Tech and AI Companies
Or build your own from over 50 metrics.
Have feedback on this article? Concerned about the content? Get in touch with us directly. Alternatively, email editorial-team (at) simplywallst.com.
This article by Simply Wall St is general in nature. We provide commentary based on historical data and analyst forecasts only using an unbiased methodology and our articles are not intended to be financial advice. It does not constitute a recommendation to buy or sell any stock, and does not take account of your objectives, or your financial situation. We aim to bring you long-term focused analysis driven by fundamental data. Note that our analysis may not factor in the latest price-sensitive company announcements or qualitative material. Simply Wall St has no position in any stocks mentioned.
About SEHK:2285
Chervon Holdings
Engages in the research, development, manufacture, testing, sale, and after-sale servicing of power tools, outdoor power equipment, and related products in North America, Europe, China, and internationally.
Flawless balance sheet average dividend payer.
Market Insights
Community Narratives


Recently Updated Narratives

TAV Havalimanlari Holding will fly high with 25.68% revenue growth


Fiducian: Compliance Clouds or Value Opportunity?


Q3 Outlook modestly optimistic
Popular Narratives


MicroVision will explode future revenue by 380.37% with a vision towards success


The company that turned a verb into a global necessity and basically runs the modern internet, digital ads, smartphones, maps, and AI.


