Xtep International Holdings Limited (HKG:1368) Shares Could Be 43% Below Their Intrinsic Value Estimate


Key Insights
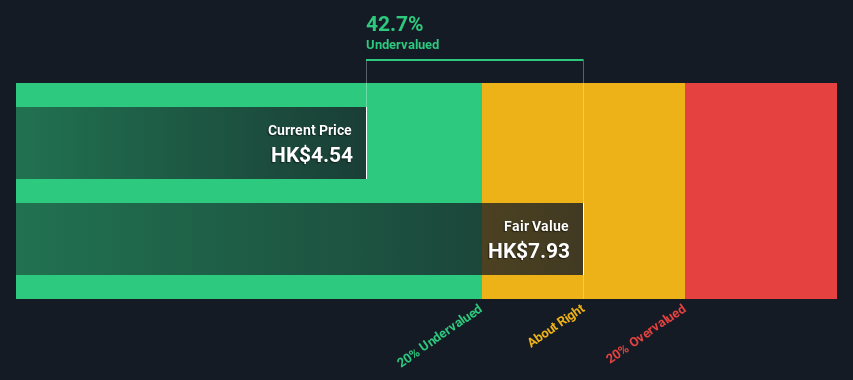
- Using the 2 Stage Free Cash Flow to Equity, Xtep International Holdings fair value estimate is HK$7.93
- Xtep International Holdings' HK$4.54 share price signals that it might be 43% undervalued
- The CN¥6.15 analyst price target for 1368 is 22% less than our estimate of fair value
Today we will run through one way of estimating the intrinsic value of Xtep International Holdings Limited (HKG:1368) by taking the expected future cash flows and discounting them to their present value. This will be done using the Discounted Cash Flow (DCF) model. Before you think you won't be able to understand it, just read on! It's actually much less complex than you'd imagine.
Companies can be valued in a lot of ways, so we would point out that a DCF is not perfect for every situation. If you want to learn more about discounted cash flow, the rationale behind this calculation can be read in detail in the Simply Wall St analysis model.
Check out our latest analysis for Xtep International Holdings
The Method
We use what is known as a 2-stage model, which simply means we have two different periods of growth rates for the company's cash flows. Generally the first stage is higher growth, and the second stage is a lower growth phase. To start off with, we need to estimate the next ten years of cash flows. Where possible we use analyst estimates, but when these aren't available we extrapolate the previous free cash flow (FCF) from the last estimate or reported value. We assume companies with shrinking free cash flow will slow their rate of shrinkage, and that companies with growing free cash flow will see their growth rate slow, over this period. We do this to reflect that growth tends to slow more in the early years than it does in later years.
Generally we assume that a dollar today is more valuable than a dollar in the future, and so the sum of these future cash flows is then discounted to today's value:
10-year free cash flow (FCF) forecast
| 2025 | 2026 | 2027 | 2028 | 2029 | 2030 | 2031 | 2032 | 2033 | 2034 | |
| Levered FCF (CN¥, Millions) | CN¥1.05b | CN¥1.25b | CN¥1.33b | CN¥1.39b | CN¥1.45b | CN¥1.50b | CN¥1.54b | CN¥1.58b | CN¥1.63b | CN¥1.67b |
| Growth Rate Estimate Source | Analyst x7 | Analyst x8 | Est @ 5.87% | Est @ 4.76% | Est @ 3.97% | Est @ 3.43% | Est @ 3.04% | Est @ 2.78% | Est @ 2.59% | Est @ 2.46% |
| Present Value (CN¥, Millions) Discounted @ 9.3% | CN¥963 | CN¥1.1k | CN¥1.0k | CN¥975 | CN¥928 | CN¥878 | CN¥828 | CN¥778 | CN¥731 | CN¥685 |
("Est" = FCF growth rate estimated by Simply Wall St)
Present Value of 10-year Cash Flow (PVCF) = CN¥8.8b
We now need to calculate the Terminal Value, which accounts for all the future cash flows after this ten year period. The Gordon Growth formula is used to calculate Terminal Value at a future annual growth rate equal to the 5-year average of the 10-year government bond yield of 2.2%. We discount the terminal cash flows to today's value at a cost of equity of 9.3%.
Terminal Value (TV)= FCF2034 × (1 + g) ÷ (r – g) = CN¥1.7b× (1 + 2.2%) ÷ (9.3%– 2.2%) = CN¥24b
Present Value of Terminal Value (PVTV)= TV / (1 + r)10= CN¥24b÷ ( 1 + 9.3%)10= CN¥9.8b
The total value, or equity value, is then the sum of the present value of the future cash flows, which in this case is CN¥19b. To get the intrinsic value per share, we divide this by the total number of shares outstanding. Relative to the current share price of HK$4.5, the company appears quite good value at a 43% discount to where the stock price trades currently. Valuations are imprecise instruments though, rather like a telescope - move a few degrees and end up in a different galaxy. Do keep this in mind.
The Assumptions
Now the most important inputs to a discounted cash flow are the discount rate, and of course, the actual cash flows. If you don't agree with these result, have a go at the calculation yourself and play with the assumptions. The DCF also does not consider the possible cyclicality of an industry, or a company's future capital requirements, so it does not give a full picture of a company's potential performance. Given that we are looking at Xtep International Holdings as potential shareholders, the cost of equity is used as the discount rate, rather than the cost of capital (or weighted average cost of capital, WACC) which accounts for debt. In this calculation we've used 9.3%, which is based on a levered beta of 1.268. Beta is a measure of a stock's volatility, compared to the market as a whole. We get our beta from the industry average beta of globally comparable companies, with an imposed limit between 0.8 and 2.0, which is a reasonable range for a stable business.
SWOT Analysis for Xtep International Holdings
- Earnings growth over the past year exceeded its 5-year average.
- Debt is not viewed as a risk.
- Dividends are covered by earnings and cash flows.
- Earnings growth over the past year underperformed the Luxury industry.
- Dividend is low compared to the top 25% of dividend payers in the Luxury market.
- Annual earnings are forecast to grow faster than the Hong Kong market.
- Good value based on P/E ratio and estimated fair value.
- Revenue is forecast to grow slower than 20% per year.
Moving On:
Although the valuation of a company is important, it ideally won't be the sole piece of analysis you scrutinize for a company. DCF models are not the be-all and end-all of investment valuation. Instead the best use for a DCF model is to test certain assumptions and theories to see if they would lead to the company being undervalued or overvalued. For instance, if the terminal value growth rate is adjusted slightly, it can dramatically alter the overall result. Can we work out why the company is trading at a discount to intrinsic value? For Xtep International Holdings, we've compiled three important factors you should look at:
- Risks: We feel that you should assess the 1 warning sign for Xtep International Holdings we've flagged before making an investment in the company.
- Future Earnings: How does 1368's growth rate compare to its peers and the wider market? Dig deeper into the analyst consensus number for the upcoming years by interacting with our free analyst growth expectation chart.
- Other Solid Businesses: Low debt, high returns on equity and good past performance are fundamental to a strong business. Why not explore our interactive list of stocks with solid business fundamentals to see if there are other companies you may not have considered!
PS. The Simply Wall St app conducts a discounted cash flow valuation for every stock on the SEHK every day. If you want to find the calculation for other stocks just search here.
If you're looking to trade Xtep International Holdings, open an account with the lowest-cost platform trusted by professionals, Interactive Brokers.
With clients in over 200 countries and territories, and access to 160 markets, IBKR lets you trade stocks, options, futures, forex, bonds and funds from a single integrated account.
Enjoy no hidden fees, no account minimums, and FX conversion rates as low as 0.03%, far better than what most brokers offer.
Sponsored ContentNew: AI Stock Screener & Alerts
Our new AI Stock Screener scans the market every day to uncover opportunities.
• Dividend Powerhouses (3%+ Yield)
• Undervalued Small Caps with Insider Buying
• High growth Tech and AI Companies
Or build your own from over 50 metrics.
Have feedback on this article? Concerned about the content? Get in touch with us directly. Alternatively, email editorial-team (at) simplywallst.com.
This article by Simply Wall St is general in nature. We provide commentary based on historical data and analyst forecasts only using an unbiased methodology and our articles are not intended to be financial advice. It does not constitute a recommendation to buy or sell any stock, and does not take account of your objectives, or your financial situation. We aim to bring you long-term focused analysis driven by fundamental data. Note that our analysis may not factor in the latest price-sensitive company announcements or qualitative material. Simply Wall St has no position in any stocks mentioned.
Have feedback on this article? Concerned about the content? Get in touch with us directly. Alternatively, email editorial-team@simplywallst.com
About SEHK:1368
Xtep International Holdings
Designs, develops, manufactures, markets, and sells sports footwear, apparel, and accessories for adults and children in Mainland China.
Excellent balance sheet average dividend payer.
Market Insights

Community Narratives

