Risks Still Elevated At These Prices As Miko International Holdings Limited (HKG:1247) Shares Dive 27%


The Miko International Holdings Limited (HKG:1247) share price has softened a substantial 27% over the previous 30 days, handing back much of the gains the stock has made lately. Of course, over the longer-term many would still wish they owned shares as the stock's price has soared 226% in the last twelve months.
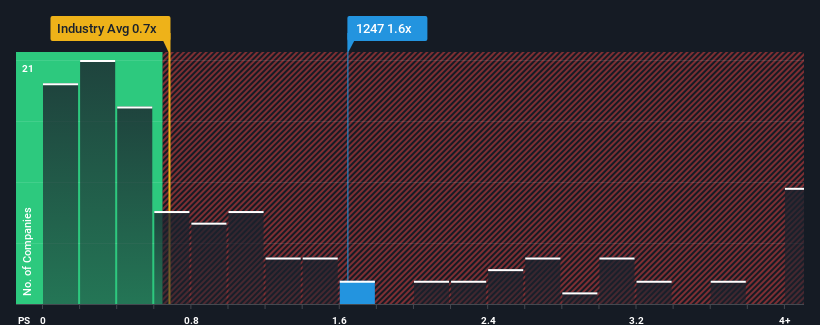
Even after such a large drop in price, given close to half the companies operating in Hong Kong's Luxury industry have price-to-sales ratios (or "P/S") below 0.7x, you may still consider Miko International Holdings as a stock to potentially avoid with its 1.6x P/S ratio. However, the P/S might be high for a reason and it requires further investigation to determine if it's justified.
View our latest analysis for Miko International Holdings
What Does Miko International Holdings' Recent Performance Look Like?
The revenue growth achieved at Miko International Holdings over the last year would be more than acceptable for most companies. One possibility is that the P/S ratio is high because investors think this respectable revenue growth will be enough to outperform the broader industry in the near future. However, if this isn't the case, investors might get caught out paying too much for the stock.
Although there are no analyst estimates available for Miko International Holdings, take a look at this free data-rich visualisation to see how the company stacks up on earnings, revenue and cash flow.How Is Miko International Holdings' Revenue Growth Trending?
There's an inherent assumption that a company should outperform the industry for P/S ratios like Miko International Holdings' to be considered reasonable.
If we review the last year of revenue growth, the company posted a terrific increase of 26%. The strong recent performance means it was also able to grow revenue by 47% in total over the last three years. Accordingly, shareholders would have definitely welcomed those medium-term rates of revenue growth.
Comparing that to the industry, which is predicted to deliver 12% growth in the next 12 months, the company's momentum is pretty similar based on recent medium-term annualised revenue results.
In light of this, it's curious that Miko International Holdings' P/S sits above the majority of other companies. It seems most investors are ignoring the fairly average recent growth rates and are willing to pay up for exposure to the stock. Although, additional gains will be difficult to achieve as a continuation of recent revenue trends would weigh down the share price eventually.
The Key Takeaway
Despite the recent share price weakness, Miko International Holdings' P/S remains higher than most other companies in the industry. Typically, we'd caution against reading too much into price-to-sales ratios when settling on investment decisions, though it can reveal plenty about what other market participants think about the company.
Our look into Miko International Holdings has shown that it currently trades on a higher than expected P/S since its recent three-year growth is only in line with the wider industry forecast. Right now we are uncomfortable with the high P/S as this revenue performance isn't likely to support such positive sentiment for long. Unless there is a significant improvement in the company's medium-term trends, it will be difficult to prevent the P/S ratio from declining to a more reasonable level.
Before you settle on your opinion, we've discovered 2 warning signs for Miko International Holdings that you should be aware of.
If companies with solid past earnings growth is up your alley, you may wish to see this free collection of other companies with strong earnings growth and low P/E ratios.
New: Manage All Your Stock Portfolios in One Place
We've created the ultimate portfolio companion for stock investors, and it's free.
• Connect an unlimited number of Portfolios and see your total in one currency
• Be alerted to new Warning Signs or Risks via email or mobile
• Track the Fair Value of your stocks
Have feedback on this article? Concerned about the content? Get in touch with us directly. Alternatively, email editorial-team (at) simplywallst.com.
This article by Simply Wall St is general in nature. We provide commentary based on historical data and analyst forecasts only using an unbiased methodology and our articles are not intended to be financial advice. It does not constitute a recommendation to buy or sell any stock, and does not take account of your objectives, or your financial situation. We aim to bring you long-term focused analysis driven by fundamental data. Note that our analysis may not factor in the latest price-sensitive company announcements or qualitative material. Simply Wall St has no position in any stocks mentioned.
About SEHK:1247
Miko International Holdings
Designs, manufactures, wholesales, retails, and sells infant and children’s apparel, footwear, and other accessories in the People’s Republic of China.
Flawless balance sheet and slightly overvalued.
