- Hong Kong
- /
- Professional Services
- /
- SEHK:2225
Here's What's Concerning About Jinhai International Group Holdings' (HKG:2225) Returns On Capital


When it comes to investing, there are some useful financial metrics that can warn us when a business is potentially in trouble. Businesses in decline often have two underlying trends, firstly, a declining return on capital employed (ROCE) and a declining base of capital employed. This indicates to us that the business is not only shrinking the size of its net assets, but its returns are falling as well. On that note, looking into Jinhai International Group Holdings (HKG:2225), we weren't too upbeat about how things were going.
Return On Capital Employed (ROCE): What Is It?
If you haven't worked with ROCE before, it measures the 'return' (pre-tax profit) a company generates from capital employed in its business. The formula for this calculation on Jinhai International Group Holdings is:
Return on Capital Employed = Earnings Before Interest and Tax (EBIT) ÷ (Total Assets - Current Liabilities)
0.000016 = S$417 ÷ (S$40m - S$14m) (Based on the trailing twelve months to December 2022).
Therefore, Jinhai International Group Holdings has an ROCE of 0.002%. In absolute terms, that's a low return and it also under-performs the Professional Services industry average of 13%.
Check out our latest analysis for Jinhai International Group Holdings
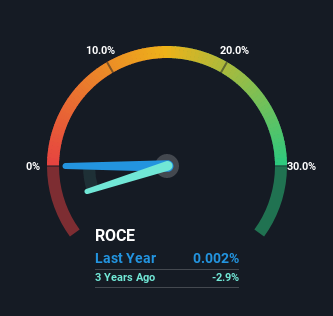
Historical performance is a great place to start when researching a stock so above you can see the gauge for Jinhai International Group Holdings' ROCE against it's prior returns. If you want to delve into the historical earnings, revenue and cash flow of Jinhai International Group Holdings, check out these free graphs here.
So How Is Jinhai International Group Holdings' ROCE Trending?
There is reason to be cautious about Jinhai International Group Holdings, given the returns are trending downwards. Unfortunately the returns on capital have diminished from the 15% that they were earning five years ago. Meanwhile, capital employed in the business has stayed roughly the flat over the period. This combination can be indicative of a mature business that still has areas to deploy capital, but the returns received aren't as high due potentially to new competition or smaller margins. So because these trends aren't typically conducive to creating a multi-bagger, we wouldn't hold our breath on Jinhai International Group Holdings becoming one if things continue as they have.
On a side note, Jinhai International Group Holdings' current liabilities have increased over the last five years to 35% of total assets, effectively distorting the ROCE to some degree. Without this increase, it's likely that ROCE would be even lower than 0.002%. Keep an eye on this ratio, because the business could encounter some new risks if this metric gets too high.
Our Take On Jinhai International Group Holdings' ROCE
In the end, the trend of lower returns on the same amount of capital isn't typically an indication that we're looking at a growth stock. In spite of that, the stock has delivered a 26% return to shareholders who held over the last five years. Regardless, we don't like the trends as they are and if they persist, we think you might find better investments elsewhere.
One more thing, we've spotted 1 warning sign facing Jinhai International Group Holdings that you might find interesting.
While Jinhai International Group Holdings isn't earning the highest return, check out this free list of companies that are earning high returns on equity with solid balance sheets.
New: Manage All Your Stock Portfolios in One Place
We've created the ultimate portfolio companion for stock investors, and it's free.
• Connect an unlimited number of Portfolios and see your total in one currency
• Be alerted to new Warning Signs or Risks via email or mobile
• Track the Fair Value of your stocks
Have feedback on this article? Concerned about the content? Get in touch with us directly. Alternatively, email editorial-team (at) simplywallst.com.
This article by Simply Wall St is general in nature. We provide commentary based on historical data and analyst forecasts only using an unbiased methodology and our articles are not intended to be financial advice. It does not constitute a recommendation to buy or sell any stock, and does not take account of your objectives, or your financial situation. We aim to bring you long-term focused analysis driven by fundamental data. Note that our analysis may not factor in the latest price-sensitive company announcements or qualitative material. Simply Wall St has no position in any stocks mentioned.
About SEHK:2225
Jinhai Medical Technology
An investment holding company, primarily engages in the provision of manpower outsourcing and ancillary services to building and construction contractors in Singapore.
Mediocre balance sheet very low.
