
Advertisement
- Hong Kong
- /
- Trade Distributors
- /
- SEHK:997
Is Chinlink International Holdings (HKG:997) Using Too Much Debt?

Legendary fund manager Li Lu (who Charlie Munger backed) once said, 'The biggest investment risk is not the volatility of prices, but whether you will suffer a permanent loss of capital.' So it seems the smart money knows that debt - which is usually involved in bankruptcies - is a very important factor, when you assess how risky a company is. Importantly, Chinlink International Holdings Limited (HKG:997) does carry debt. But should shareholders be worried about its use of debt?
Why Does Debt Bring Risk?
Debt is a tool to help businesses grow, but if a business is incapable of paying off its lenders, then it exists at their mercy. Part and parcel of capitalism is the process of 'creative destruction' where failed businesses are mercilessly liquidated by their bankers. However, a more frequent (but still costly) occurrence is where a company must issue shares at bargain-basement prices, permanently diluting shareholders, just to shore up its balance sheet. Of course, debt can be an important tool in businesses, particularly capital heavy businesses. When we think about a company's use of debt, we first look at cash and debt together.
View our latest analysis for Chinlink International Holdings
How Much Debt Does Chinlink International Holdings Carry?
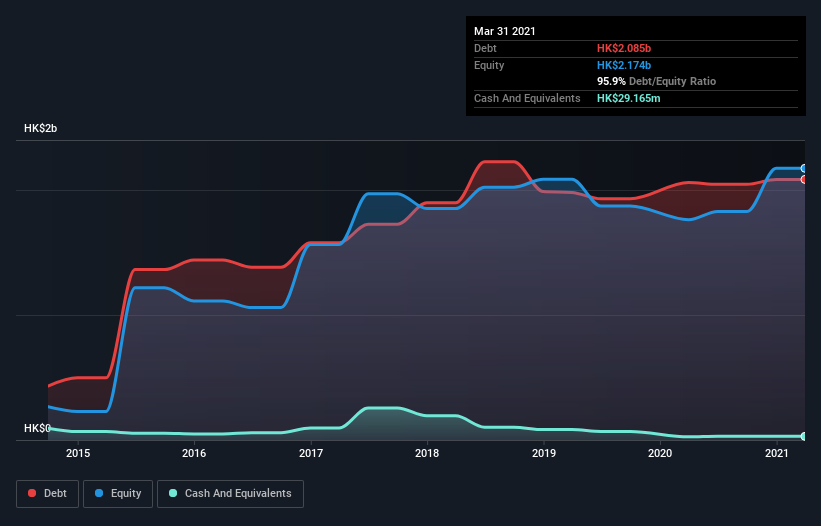
As you can see below, Chinlink International Holdings had HK$2.08b of debt, at March 2021, which is about the same as the year before. You can click the chart for greater detail. Net debt is about the same, since the it doesn't have much cash.
How Healthy Is Chinlink International Holdings' Balance Sheet?
Zooming in on the latest balance sheet data, we can see that Chinlink International Holdings had liabilities of HK$1.84b due within 12 months and liabilities of HK$1.27b due beyond that. On the other hand, it had cash of HK$29.2m and HK$373.2m worth of receivables due within a year. So its liabilities total HK$2.71b more than the combination of its cash and short-term receivables.
This deficit casts a shadow over the HK$409.3m company, like a colossus towering over mere mortals. So we'd watch its balance sheet closely, without a doubt. After all, Chinlink International Holdings would likely require a major re-capitalisation if it had to pay its creditors today.
We measure a company's debt load relative to its earnings power by looking at its net debt divided by its earnings before interest, tax, depreciation, and amortization (EBITDA) and by calculating how easily its earnings before interest and tax (EBIT) cover its interest expense (interest cover). The advantage of this approach is that we take into account both the absolute quantum of debt (with net debt to EBITDA) and the actual interest expenses associated with that debt (with its interest cover ratio).
Chinlink International Holdings shareholders face the double whammy of a high net debt to EBITDA ratio (39.6), and fairly weak interest coverage, since EBIT is just 0.18 times the interest expense. This means we'd consider it to have a heavy debt load. The silver lining is that Chinlink International Holdings grew its EBIT by 426% last year, which nourishing like the idealism of youth. If that earnings trend continues it will make its debt load much more manageable in the future. When analysing debt levels, the balance sheet is the obvious place to start. But it is Chinlink International Holdings's earnings that will influence how the balance sheet holds up in the future. So when considering debt, it's definitely worth looking at the earnings trend. Click here for an interactive snapshot.
Finally, a business needs free cash flow to pay off debt; accounting profits just don't cut it. So we clearly need to look at whether that EBIT is leading to corresponding free cash flow. Over the last three years, Chinlink International Holdings saw substantial negative free cash flow, in total. While investors are no doubt expecting a reversal of that situation in due course, it clearly does mean its use of debt is more risky.
Our View
To be frank both Chinlink International Holdings's conversion of EBIT to free cash flow and its track record of staying on top of its total liabilities make us rather uncomfortable with its debt levels. But at least it's pretty decent at growing its EBIT; that's encouraging. Taking into account all the aforementioned factors, it looks like Chinlink International Holdings has too much debt. While some investors love that sort of risky play, it's certainly not our cup of tea. The balance sheet is clearly the area to focus on when you are analysing debt. But ultimately, every company can contain risks that exist outside of the balance sheet. To that end, you should learn about the 5 warning signs we've spotted with Chinlink International Holdings (including 3 which are potentially serious) .
If you're interested in investing in businesses that can grow profits without the burden of debt, then check out this free list of growing businesses that have net cash on the balance sheet.
When trading stocks or any other investment, use the platform considered by many to be the Professional's Gateway to the Worlds Market, Interactive Brokers. You get the lowest-cost* trading on stocks, options, futures, forex, bonds and funds worldwide from a single integrated account. Promoted
New: AI Stock Screener & Alerts
Our new AI Stock Screener scans the market every day to uncover opportunities.
• Dividend Powerhouses (3%+ Yield)
• Undervalued Small Caps with Insider Buying
• High growth Tech and AI Companies
Or build your own from over 50 metrics.
This article by Simply Wall St is general in nature. We provide commentary based on historical data and analyst forecasts only using an unbiased methodology and our articles are not intended to be financial advice. It does not constitute a recommendation to buy or sell any stock, and does not take account of your objectives, or your financial situation. We aim to bring you long-term focused analysis driven by fundamental data. Note that our analysis may not factor in the latest price-sensitive company announcements or qualitative material. Simply Wall St has no position in any stocks mentioned.
*Interactive Brokers Rated Lowest Cost Broker by StockBrokers.com Annual Online Review 2020
Have feedback on this article? Concerned about the content? Get in touch with us directly. Alternatively, email editorial-team (at) simplywallst.com.
About SEHK:997
Chinlink International Holdings
An investment holding company, provides property investment services in the People’s Republic of China and Hong Kong.
Slight and slightly overvalued.
Market Insights

Advertisement
Community Narratives
Groundbreaking therapies that could change the treatment landscape for PTSD, fibromyalgia, MS & Alzheimer’s
Fair Value US$6.20|86.9% undervalued
CM
Community Contributor
DigitalOcean Will Grow 14% by Embracing AI with Paperspace Acquisition
Fair Value US$50.00|42.8% undervalued
NE
Community Contributor
Viant Technology: A Rising AdTech Challenger in the AI-Powered CTV Market
Fair Value US$38.61|66.0% undervalued
BL
Community Contributor
Volvo will Accelerate Forward into Electric and Autonomous Leadership in Five Years
Fair Value SEK 438.80|40.8% undervalued
UN
Community Contributor