
Advertisement
- Hong Kong
- /
- Construction
- /
- SEHK:9900
Despite the downward trend in earnings at Gain Plus Holdings (HKG:9900) the stock soars 17%, bringing one-year gains to 159%

When you buy shares in a company, there is always a risk that the price drops to zero. But if you pick the right business to buy shares in, you can make more than you can lose. Take, for example Gain Plus Holdings Limited (HKG:9900). Its share price is already up an impressive 129% in the last twelve months. Also pleasing for shareholders was the 57% gain in the last three months. However, the stock hasn't done so well in the longer term, with the stock only up 13% in three years.
Since the stock has added HK$126m to its market cap in the past week alone, let's see if underlying performance has been driving long-term returns.
View our latest analysis for Gain Plus Holdings
In his essay The Superinvestors of Graham-and-Doddsville Warren Buffett described how share prices do not always rationally reflect the value of a business. One way to examine how market sentiment has changed over time is to look at the interaction between a company's share price and its earnings per share (EPS).
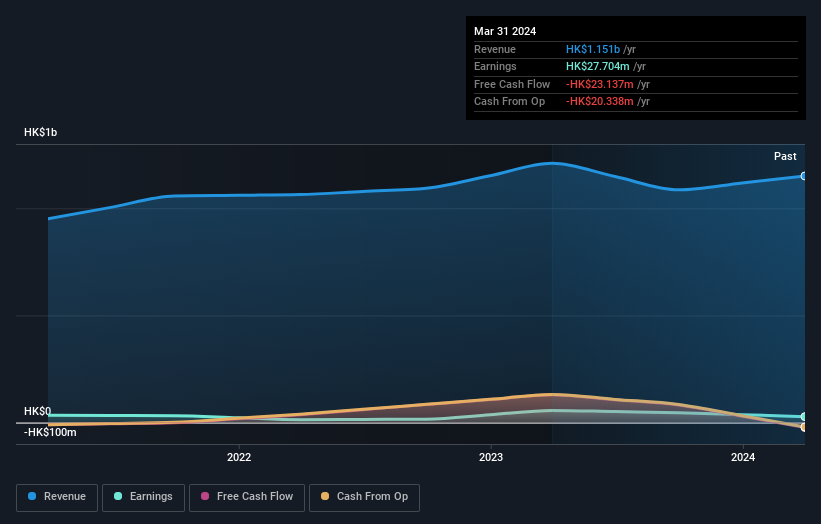
During the last year, Gain Plus Holdings actually saw its earnings per share drop 51%.
This means it's unlikely the market is judging the company based on earnings growth. Therefore, it seems likely that investors are putting more weight on metrics other than EPS, at the moment.
Absent any improvement, we don't think a thirst for dividends is pushing up the Gain Plus Holdings' share price. It saw it's revenue decline by 4.9% over twelve months. Usually that correlates with a lower share price, but let's face it, the gyrations of the market are sometimes only as clear as mud.
The company's revenue and earnings (over time) are depicted in the image below (click to see the exact numbers).
This free interactive report on Gain Plus Holdings' balance sheet strength is a great place to start, if you want to investigate the stock further.
What About Dividends?
As well as measuring the share price return, investors should also consider the total shareholder return (TSR). The TSR incorporates the value of any spin-offs or discounted capital raisings, along with any dividends, based on the assumption that the dividends are reinvested. So for companies that pay a generous dividend, the TSR is often a lot higher than the share price return. In the case of Gain Plus Holdings, it has a TSR of 159% for the last 1 year. That exceeds its share price return that we previously mentioned. And there's no prize for guessing that the dividend payments largely explain the divergence!
A Different Perspective
It's good to see that Gain Plus Holdings has rewarded shareholders with a total shareholder return of 159% in the last twelve months. Of course, that includes the dividend. That's better than the annualised return of 12% over half a decade, implying that the company is doing better recently. Someone with an optimistic perspective could view the recent improvement in TSR as indicating that the business itself is getting better with time. I find it very interesting to look at share price over the long term as a proxy for business performance. But to truly gain insight, we need to consider other information, too. Consider for instance, the ever-present spectre of investment risk. We've identified 2 warning signs with Gain Plus Holdings (at least 1 which doesn't sit too well with us) , and understanding them should be part of your investment process.
Of course Gain Plus Holdings may not be the best stock to buy. So you may wish to see this free collection of growth stocks.
Please note, the market returns quoted in this article reflect the market weighted average returns of stocks that currently trade on Hong Kong exchanges.
New: Manage All Your Stock Portfolios in One Place
We've created the ultimate portfolio companion for stock investors, and it's free.
• Connect an unlimited number of Portfolios and see your total in one currency
• Be alerted to new Warning Signs or Risks via email or mobile
• Track the Fair Value of your stocks
Have feedback on this article? Concerned about the content? Get in touch with us directly. Alternatively, email editorial-team (at) simplywallst.com.
This article by Simply Wall St is general in nature. We provide commentary based on historical data and analyst forecasts only using an unbiased methodology and our articles are not intended to be financial advice. It does not constitute a recommendation to buy or sell any stock, and does not take account of your objectives, or your financial situation. We aim to bring you long-term focused analysis driven by fundamental data. Note that our analysis may not factor in the latest price-sensitive company announcements or qualitative material. Simply Wall St has no position in any stocks mentioned.
About SEHK:9900
Gain Plus Holdings
An investment holding company, engages in the provision of construction contracting services for public and private sectors in Hong Kong.
Flawless balance sheet with questionable track record.
Market Insights

Advertisement
Community Narratives

Apple: A Dying Star with an Overpriced Valuation
Fair Value US$177.34|19.7% overvalued
IN
Community Contributor
Avino a case for USD$20 per share within 5 years (assuming $3,500 gold, $100 silver and $4 copper).
Fair Value CA$26.79|87.9% undervalued
AG
Community Contributor
Riding the Defense Boom RENK Sees Revenue Climb at 15% CAGR by FY 2029
Fair Value €69.87|24.5% undervalued
CH
Community Contributor