- Hong Kong
- /
- Trade Distributors
- /
- SEHK:8196
These Return Metrics Don't Make China TianYF Holdings Group (HKG:8196) Look Too Strong


When researching a stock for investment, what can tell us that the company is in decline? More often than not, we'll see a declining return on capital employed (ROCE) and a declining amount of capital employed. Trends like this ultimately mean the business is reducing its investments and also earning less on what it has invested. On that note, looking into China TianYF Holdings Group (HKG:8196), we weren't too upbeat about how things were going.
What Is Return On Capital Employed (ROCE)?
If you haven't worked with ROCE before, it measures the 'return' (pre-tax profit) a company generates from capital employed in its business. To calculate this metric for China TianYF Holdings Group, this is the formula:
Return on Capital Employed = Earnings Before Interest and Tax (EBIT) ÷ (Total Assets - Current Liabilities)
0.10 = CN¥8.7m ÷ (CN¥284m - CN¥197m) (Based on the trailing twelve months to June 2023).
So, China TianYF Holdings Group has an ROCE of 10%. In absolute terms, that's a satisfactory return, but compared to the Trade Distributors industry average of 6.3% it's much better.
View our latest analysis for China TianYF Holdings Group
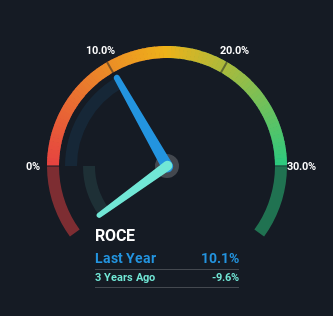
Historical performance is a great place to start when researching a stock so above you can see the gauge for China TianYF Holdings Group's ROCE against it's prior returns. If you're interested in investigating China TianYF Holdings Group's past further, check out this free graph of past earnings, revenue and cash flow.
The Trend Of ROCE
We are a bit anxious about the trends of ROCE at China TianYF Holdings Group. The company used to generate 15% on its capital five years ago but it has since fallen noticeably. On top of that, the business is utilizing 66% less capital within its operations. The combination of lower ROCE and less capital employed can indicate that a business is likely to be facing some competitive headwinds or seeing an erosion to its moat. Typically businesses that exhibit these characteristics aren't the ones that tend to multiply over the long term, because statistically speaking, they've already gone through the growth phase of their life cycle.
On a side note, China TianYF Holdings Group's current liabilities have increased over the last five years to 69% of total assets, effectively distorting the ROCE to some degree. Without this increase, it's likely that ROCE would be even lower than 10%. What this means is that in reality, a rather large portion of the business is being funded by the likes of the company's suppliers or short-term creditors, which can bring some risks of its own.
The Key Takeaway
In short, lower returns and decreasing amounts capital employed in the business doesn't fill us with confidence. This could explain why the stock has sunk a total of 83% in the last five years. Unless there is a shift to a more positive trajectory in these metrics, we would look elsewhere.
China TianYF Holdings Group does come with some risks though, we found 3 warning signs in our investment analysis, and 1 of those shouldn't be ignored...
While China TianYF Holdings Group isn't earning the highest return, check out this free list of companies that are earning high returns on equity with solid balance sheets.
If you're looking to trade Futian Holdings, open an account with the lowest-cost platform trusted by professionals, Interactive Brokers.
With clients in over 200 countries and territories, and access to 160 markets, IBKR lets you trade stocks, options, futures, forex, bonds and funds from a single integrated account.
Enjoy no hidden fees, no account minimums, and FX conversion rates as low as 0.03%, far better than what most brokers offer.
Sponsored ContentNew: AI Stock Screener & Alerts
Our new AI Stock Screener scans the market every day to uncover opportunities.
• Dividend Powerhouses (3%+ Yield)
• Undervalued Small Caps with Insider Buying
• High growth Tech and AI Companies
Or build your own from over 50 metrics.
Have feedback on this article? Concerned about the content? Get in touch with us directly. Alternatively, email editorial-team (at) simplywallst.com.
This article by Simply Wall St is general in nature. We provide commentary based on historical data and analyst forecasts only using an unbiased methodology and our articles are not intended to be financial advice. It does not constitute a recommendation to buy or sell any stock, and does not take account of your objectives, or your financial situation. We aim to bring you long-term focused analysis driven by fundamental data. Note that our analysis may not factor in the latest price-sensitive company announcements or qualitative material. Simply Wall St has no position in any stocks mentioned.
About SEHK:8196
Futian Holdings
An investment holding company, provides engineering services for wastewater and drinking water treatment facilities in Mainland China and Vietnam.
Flawless balance sheet and fair value.
Market Insights

Community Narratives

