
Advertisement
- Hong Kong
- /
- Electrical
- /
- SEHK:8136
Are IMS Group Holdings Limited's (HKG:8136) Mixed Financials The Reason For Its Gloomy Performance on The Stock Market?

IMS Group Holdings (HKG:8136) has had a rough month with its share price down 24%. It seems that the market might have completely ignored the positive aspects of the company's fundamentals and decided to weigh-in more on the negative aspects. Long-term fundamentals are usually what drive market outcomes, so it's worth paying close attention. In this article, we decided to focus on IMS Group Holdings' ROE.
ROE or return on equity is a useful tool to assess how effectively a company can generate returns on the investment it received from its shareholders. In other words, it is a profitability ratio which measures the rate of return on the capital provided by the company's shareholders.
View our latest analysis for IMS Group Holdings
How Do You Calculate Return On Equity?
The formula for return on equity is:
Return on Equity = Net Profit (from continuing operations) ÷ Shareholders' Equity
So, based on the above formula, the ROE for IMS Group Holdings is:
13% = HK$9.6m ÷ HK$74m (Based on the trailing twelve months to June 2021).
The 'return' is the profit over the last twelve months. So, this means that for every HK$1 of its shareholder's investments, the company generates a profit of HK$0.13.
What Is The Relationship Between ROE And Earnings Growth?
We have already established that ROE serves as an efficient profit-generating gauge for a company's future earnings. Depending on how much of these profits the company reinvests or "retains", and how effectively it does so, we are then able to assess a company’s earnings growth potential. Generally speaking, other things being equal, firms with a high return on equity and profit retention, have a higher growth rate than firms that don’t share these attributes.
IMS Group Holdings' Earnings Growth And 13% ROE
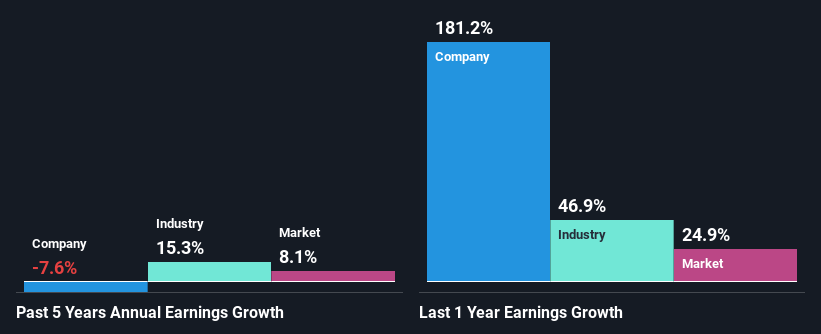
At first glance, IMS Group Holdings seems to have a decent ROE. And on comparing with the industry, we found that the the average industry ROE is similar at 11%. For this reason, IMS Group Holdings' five year net income decline of 7.6% raises the question as to why the decent ROE didn't translate into growth. So, there might be some other aspects that could explain this. For example, it could be that the company has a high payout ratio or the business has allocated capital poorly, for instance.
However, when we compared IMS Group Holdings' growth with the industry we found that while the company's earnings have been shrinking, the industry has seen an earnings growth of 15% in the same period. This is quite worrisome.
The basis for attaching value to a company is, to a great extent, tied to its earnings growth. What investors need to determine next is if the expected earnings growth, or the lack of it, is already built into the share price. This then helps them determine if the stock is placed for a bright or bleak future. One good indicator of expected earnings growth is the P/E ratio which determines the price the market is willing to pay for a stock based on its earnings prospects. So, you may want to check if IMS Group Holdings is trading on a high P/E or a low P/E, relative to its industry.
Is IMS Group Holdings Using Its Retained Earnings Effectively?
IMS Group Holdings' high three-year median payout ratio of 144% suggests that the company is depleting its resources to keep up its dividend payments, and this shows in its shrinking earnings. Its usually very hard to sustain dividend payments that are higher than reported profits. Our risks dashboard should have the 5 risks we have identified for IMS Group Holdings.
Conclusion
In total, we're a bit ambivalent about IMS Group Holdings' performance. In spite of the high ROE, the company has failed to see growth in its earnings due to it paying out most of its profits as dividend, with almost nothing left to invest into its own business. Up till now, we've only made a short study of the company's growth data. So it may be worth checking this free detailed graph of IMS Group Holdings' past earnings, as well as revenue and cash flows to get a deeper insight into the company's performance.
New: AI Stock Screener & Alerts
Our new AI Stock Screener scans the market every day to uncover opportunities.
• Dividend Powerhouses (3%+ Yield)
• Undervalued Small Caps with Insider Buying
• High growth Tech and AI Companies
Or build your own from over 50 metrics.
This article by Simply Wall St is general in nature. We provide commentary based on historical data and analyst forecasts only using an unbiased methodology and our articles are not intended to be financial advice. It does not constitute a recommendation to buy or sell any stock, and does not take account of your objectives, or your financial situation. We aim to bring you long-term focused analysis driven by fundamental data. Note that our analysis may not factor in the latest price-sensitive company announcements or qualitative material. Simply Wall St has no position in any stocks mentioned.
Have feedback on this article? Concerned about the content? Get in touch with us directly. Alternatively, email editorial-team (at) simplywallst.com.
About SEHK:8136
IMS Group Holdings
An investment holding company, engages in the provision of light-emitting diode (LED) lighting fixtures for retail stores of luxury brands in Hong Kong, the People’s Republic of China, the rest of Asia, Europe, and internationally.
Flawless balance sheet and slightly overvalued.
Similar Companies
Market Insights

Advertisement
Community Narratives
Groundbreaking therapies that could change the treatment landscape for PTSD, fibromyalgia, MS & Alzheimer’s
Fair Value US$6.20|86.9% undervalued
CM
Community Contributor
DigitalOcean Will Grow 14% by Embracing AI with Paperspace Acquisition
Fair Value US$50.00|41.7% undervalued
NE
Community Contributor
Viant Technology: A Rising AdTech Challenger in the AI-Powered CTV Market
Fair Value US$38.61|63.2% undervalued
BL
Community Contributor
Volvo will Accelerate Forward into Electric and Autonomous Leadership in Five Years
Fair Value SEK 438.80|39.7% undervalued
UN
Community Contributor