- Hong Kong
- /
- Gas Utilities
- /
- SEHK:8007
Slammed 90% Global Strategic Group Limited (HKG:8007) Screens Well Here But There Might Be A Catch


Global Strategic Group Limited (HKG:8007) shareholders that were waiting for something to happen have been dealt a blow with a 90% share price drop in the last month. The recent drop completes a disastrous twelve months for shareholders, who are sitting on a 55% loss during that time.
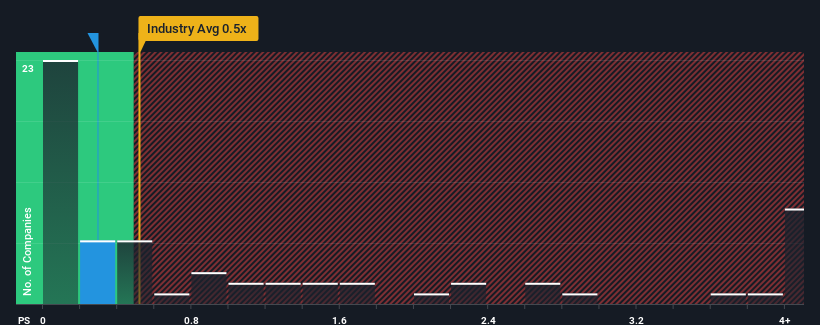
Even after such a large drop in price, you could still be forgiven for feeling indifferent about Global Strategic Group's P/S ratio of 0.3x, since the median price-to-sales (or "P/S") ratio for the Trade Distributors industry in Hong Kong is also close to 0.5x. While this might not raise any eyebrows, if the P/S ratio is not justified investors could be missing out on a potential opportunity or ignoring looming disappointment.
See our latest analysis for Global Strategic Group
What Does Global Strategic Group's Recent Performance Look Like?
Revenue has risen firmly for Global Strategic Group recently, which is pleasing to see. One possibility is that the P/S is moderate because investors think this respectable revenue growth might not be enough to outperform the broader industry in the near future. If you like the company, you'd be hoping this isn't the case so that you could potentially pick up some stock while it's not quite in favour.
Although there are no analyst estimates available for Global Strategic Group, take a look at this free data-rich visualisation to see how the company stacks up on earnings, revenue and cash flow.Is There Some Revenue Growth Forecasted For Global Strategic Group?
Global Strategic Group's P/S ratio would be typical for a company that's only expected to deliver moderate growth, and importantly, perform in line with the industry.
Taking a look back first, we see that the company grew revenue by an impressive 22% last year. Pleasingly, revenue has also lifted 289% in aggregate from three years ago, thanks to the last 12 months of growth. Therefore, it's fair to say the revenue growth recently has been superb for the company.
Comparing that to the industry, which is only predicted to deliver 3.6% growth in the next 12 months, the company's momentum is stronger based on recent medium-term annualised revenue results.
With this information, we find it interesting that Global Strategic Group is trading at a fairly similar P/S compared to the industry. Apparently some shareholders believe the recent performance is at its limits and have been accepting lower selling prices.
The Key Takeaway
Global Strategic Group's plummeting stock price has brought its P/S back to a similar region as the rest of the industry. While the price-to-sales ratio shouldn't be the defining factor in whether you buy a stock or not, it's quite a capable barometer of revenue expectations.
To our surprise, Global Strategic Group revealed its three-year revenue trends aren't contributing to its P/S as much as we would have predicted, given they look better than current industry expectations. When we see strong revenue with faster-than-industry growth, we can only assume potential risks are what might be placing pressure on the P/S ratio. At least the risk of a price drop looks to be subdued if recent medium-term revenue trends continue, but investors seem to think future revenue could see some volatility.
It's always necessary to consider the ever-present spectre of investment risk. We've identified 2 warning signs with Global Strategic Group, and understanding these should be part of your investment process.
If these risks are making you reconsider your opinion on Global Strategic Group, explore our interactive list of high quality stocks to get an idea of what else is out there.
New: Manage All Your Stock Portfolios in One Place
We've created the ultimate portfolio companion for stock investors, and it's free.
• Connect an unlimited number of Portfolios and see your total in one currency
• Be alerted to new Warning Signs or Risks via email or mobile
• Track the Fair Value of your stocks
Have feedback on this article? Concerned about the content? Get in touch with us directly. Alternatively, email editorial-team (at) simplywallst.com.
This article by Simply Wall St is general in nature. We provide commentary based on historical data and analyst forecasts only using an unbiased methodology and our articles are not intended to be financial advice. It does not constitute a recommendation to buy or sell any stock, and does not take account of your objectives, or your financial situation. We aim to bring you long-term focused analysis driven by fundamental data. Note that our analysis may not factor in the latest price-sensitive company announcements or qualitative material. Simply Wall St has no position in any stocks mentioned.
About SEHK:8007
Global Strategic Group
An investment holding company, supplies natural gas in the People’s Republic of China.
Slightly overvalued with imperfect balance sheet.

